Dimensionality Reduction
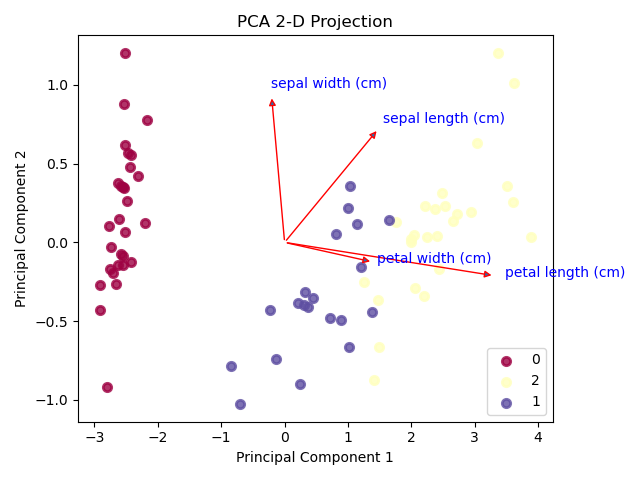
Plotting the reducing the number of random variables to consider.
Applications: Visualization, increased efficiency. Algorithms: Plots the 2-dimensional projection of PCA, Plots PCA components’ explained variance ratios, and more...
Metric Analysis
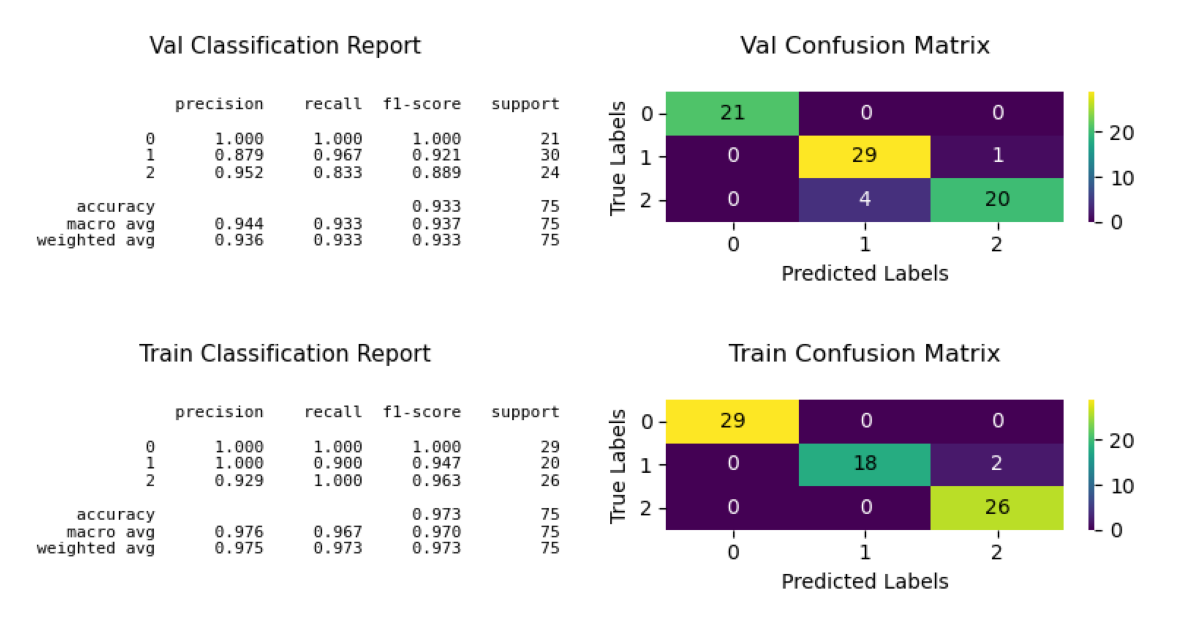
Model Evaluation: Metrics Performance Analysis.
Applications: Spam detection, image recognition. Metrics: Feature Importances, ROC AUC Curves, Precision-Recall Curves, and more...
Decile-Wise Analysis
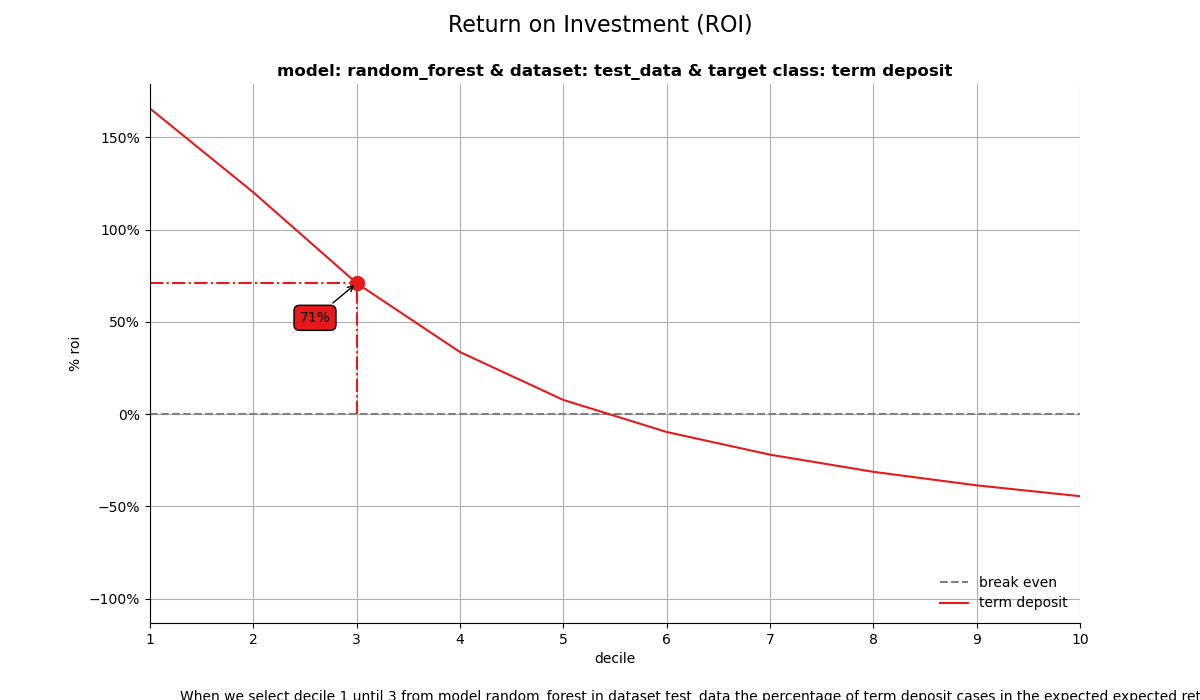
Model Evaluation: Decile-Based Performance Analysis.
Applications: Spam detection, image recognition. Algorithms: Generates the KS Statistic plot, Generates the Cumulative Gains plot, Generates the Cumulative Gains plot, and more...
Statistical Analysis
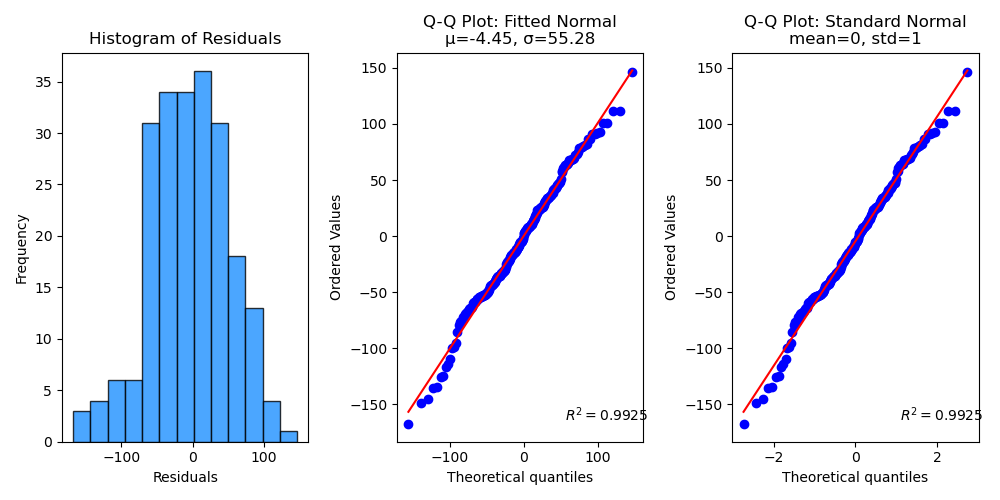
Elegant quantitative analysis tools for clear, intuitive, and insightful data visualization and interpretation.
Applications: Selecting the bin width of histograms, Model Selection, Time Series Analysis... Algorithms: Astrostatistics Tools, Tweedie Family, and more...
Array API Support (experimental)
The array API standard and specific compatibility functions for Numpy, CuPy and PyTorch is provided through `array-api-compat`.
Applications: Using the Array API standard to accelerate ML and DL model visualization. Algorithms: and more...
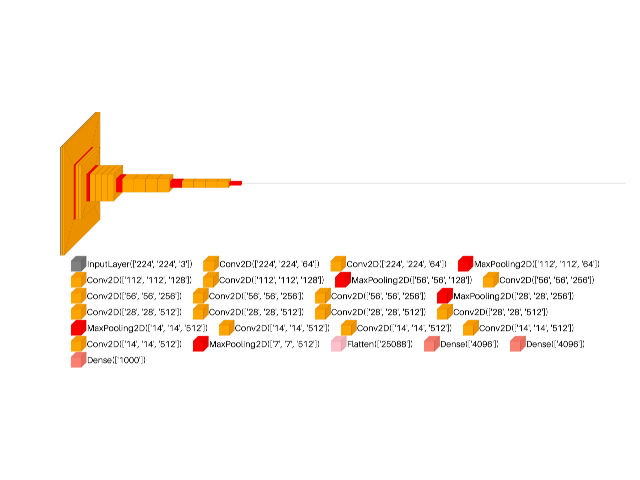
Visualkeras
Visualize Keras (either standalone or included in tensorflow) neural network architectures.
Applications: ANN, CNN, NLP Tasks... Algorithms: Graphical Visualization plot, Layered Visualization plot, and more...
# Example code to try:
from sklearn.datasets import (
  load_breast_cancer as data_2_classes,
  load_iris as data_3_classes,
  load_digits as data_10_classes,
  make_classification,
)
from sklearn.model_selection import train_test_split
from sklearn.ensemble import RandomForestClassifier
# Load the data
X, y = data_3_classes(return_X_y=True, as_frame=True)
X_train, X_val, y_train, y_val = \
      train_test_split(X, y, test_size=0.5)
# Create and train the model
model = RandomForestClassifier()\
      .fit(X_train, y_train)

#import matplotlib.pyplot as plt
import scikitplot as sp
# Plot feature importances
ax, features = sp.estimators.plot_feature_importances(
    model,
    display_bar_label=False,
    figsize=(12,5)
);To try the examples in the browser:
- Type code in the input cell and press
Shift + Enterto execute - Or copy-paste the code, and click on the
Runbutton in the toolbar - Run
micropip.list()to view installed packages.
# Check installed packages:
import micropip; micropip.list()
