plot_elbow#
- scikitplot.cluster.plot_elbow(clf, X, title='Elbow Curves', cluster_ranges=None, n_jobs=1, show_cluster_time=True, ax=None, figsize=None, title_fontsize='large', text_fontsize='medium')#
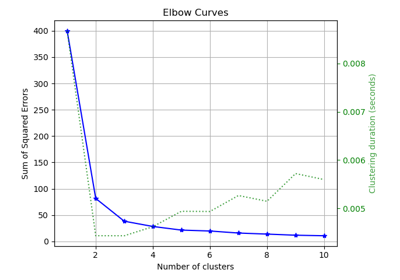
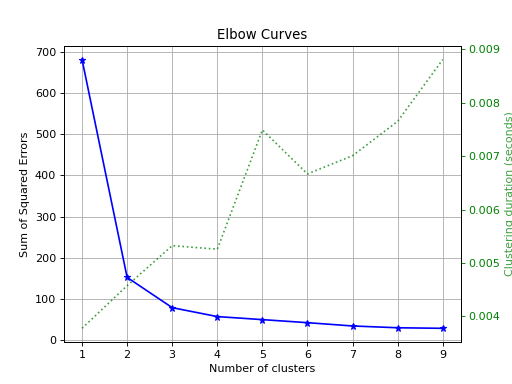
Plot the elbow curve for different values of K in KMeans clustering.
- Parameters:
clf (object) – A clusterer instance with
fit,fit_predict, andscoremethods, and ann_clustershyperparameter. Typically an instance ofsklearn.cluster.KMeans.X (array-like of shape (n_samples, n_features)) – The data to cluster, where
n_samplesis the number of samples andn_featuresis the number of features.title (str, optional, default="Elbow Plot") – The title of the generated plot.
cluster_ranges (list of int or None, optional, default=range(1, 12, 2)) – List of values for
n_clustersover which to plot the explained variances.n_jobs (int, optional, default=1) – The number of jobs to run in parallel.
show_cluster_time (bool, optional) – Whether to include a plot of the time taken to cluster for each value of K.
ax (matplotlib.axes.Axes, optional) – The axes on which to plot the curve. If None, a new set of axes will be created.
figsize (tuple, optional) – Tuple denoting the figure size of the plot, e.g., (6, 6). If None, the default size will be used.
title_fontsize (str or int, optional, default="large") – Font size of the title. Accepts Matplotlib font sizes, such as “small”, “medium”, “large”, or an integer value.
text_fontsize (str or int, optional, default="medium") – Font size of the text labels. Accepts Matplotlib font sizes, such as “small”, “medium”, “large”, or an integer value.
- Returns:
ax – The axes on which the plot was drawn.
- Return type:
Examples
>>> from sklearn.cluster import KMeans
>>> from sklearn.datasets import load_iris as data_3_classes
>>> import scikitplot as skplt
>>> X, y = data_3_classes(return_X_y=True, as_frame=False)
>>> kmeans = KMeans(random_state=0)
>>> skplt.cluster.plot_elbow(
>>>     kmeans,
>>>     X,
>>>     cluster_ranges=range(1, 10),
>>> );
(
Source code,png)