plot_silhouette#
- scikitplot.metrics.plot_silhouette(X, cluster_labels, *, metric='euclidean', copy=True, title='Silhouette Analysis', ax=None, fig=None, figsize=None, title_fontsize='large', text_fontsize='medium', cmap=None, digits=4, **kwargs)#
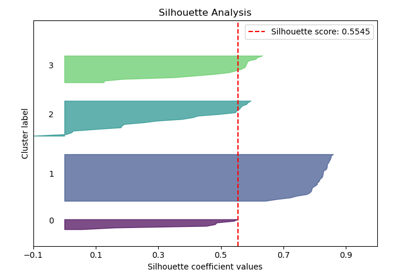
Plots silhouette analysis of clusters provided.
Silhouette analysis is a method of interpreting and validating the consistency within clusters of data. It measures how similar an object is to its own cluster compared to other clusters.
- Parameters:
X (array-like, shape (n_samples, n_features)) – Data to cluster, where
n_samplesis the number of samples andn_featuresis the number of features.cluster_labels (array-like, shape (n_samples,)) – Cluster label for each sample.
metric (str or callable, optional, default='euclidean') – The metric to use when calculating distance between instances in a feature array. If metric is a string, it must be one of the options allowed by
sklearn.metrics.pairwise.pairwise_distances. IfXis the distance array itself, use “precomputed” as the metric.copy (bool, optional, default=True) – Determines whether
fitis used onclfor on a copy ofclf.title (str, optional, default='Silhouette Analysis') – Title of the generated plot.
ax (list of matplotlib.axes.Axes, optional, default=None) – The axis to plot the figure on. If None is passed in the current axes will be used (or generated if required). Axes like
fig.add_subplot(1, 1, 1)orplt.gca()fig (matplotlib.pyplot.figure, optional, default: None) –
The figure to plot the Visualizer on. If None is passed in the current plot will be used (or generated if required).
Added in version 0.3.9.
figsize (tuple of int, optional, default=None) – Size of the figure (width, height) in inches.
title_fontsize (str or int, optional, default='large') – Font size for the plot title.
text_fontsize (str or int, optional, default='medium') – Font size for the text in the plot.
cmap (None, str or matplotlib.colors.Colormap, optional, default=None) – Colormap used for plotting. Options include ‘viridis’, ‘PiYG’, ‘plasma’, ‘inferno’, ‘nipy_spectral’, etc. See Matplotlib Colormap documentation for available choices. - https://matplotlib.org/stable/users/explain/colors/index.html
digits (int, optional, default=4) –
Number of digits for formatting output floating point values.
Added in version 0.3.9.
- Returns:
The axes on which the plot was drawn.
- Return type:
References#
Examples
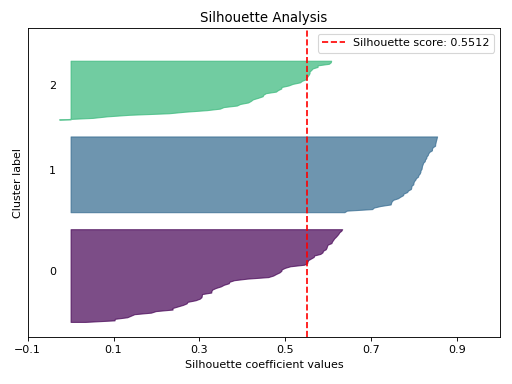
>>> from sklearn.cluster import KMeans
>>> from sklearn.datasets import load_iris as data_3_classes
>>> import scikitplot as skplt
>>> X, y = data_3_classes(return_X_y=True, as_frame=False)
>>> kmeans = KMeans(n_clusters=3, random_state=0)
>>> cluster_labels = kmeans.fit_predict(X)
>>> skplt.metrics.plot_silhouette(
>>>     X,
>>>     cluster_labels,
>>> );
(
Source code,png)