cumulative_gain_curve#
- scikitplot.api._utils.cumulative_gain_curve(y_true, y_score, pos_label=None)[source]#
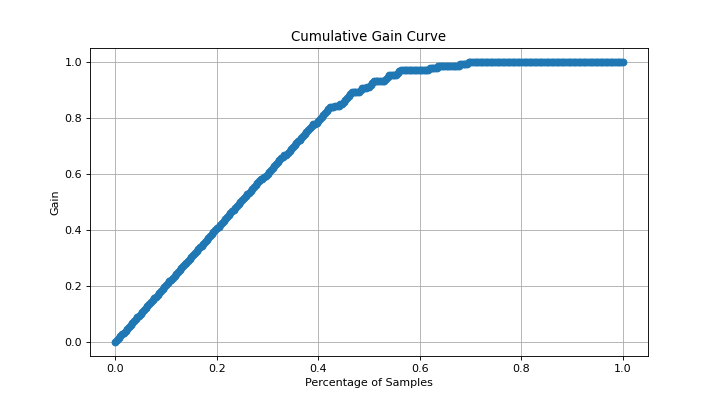
Generate the data points necessary to plot the Cumulative Gain curve for binary classification tasks.
The Cumulative Gain curve helps in visualizing how well a binary classifier identifies the positive class as more instances are considered based on predicted scores. It shows the proportion of true positives captured as a function of the total instances considered.
- Parameters:
- y_truearray-like of shape (n_samples,)
True class labels of the data. This array should contain exactly two unique classes (e.g.,
[0, 1],[-1, 1]) to represent a binary classification problem. If more than two classes are present, the function will raise aValueError.- y_scorearray-like of shape (n_samples,)
Target scores for each instance. These scores are typically the predicted probability of the positive class, confidence scores, or any non-thresholded metric produced by a classifier. It is essential that these scores be continuous rather than binary (0/1).
- pos_labelint or str, optional, default=None
The label representing the positive class. If
pos_labelis not provided, the function attempts to infer it fromy_true, assuming standard binary classification labels such as{0, 1},{-1, 1}, or a single unique class. If inference is not possible, aValueErroris raised.
- Returns:
- percentagesnumpy.ndarray of shape (n_points,)
The X-axis values representing the cumulative percentage of instances considered. Values range from 0 (no instances considered) to 1 (all instances considered), and an initial 0 is inserted at the start to represent the baseline.
- gainsnumpy.ndarray of shape (n_points,)
The Y-axis values representing the cumulative gain, i.e., the proportion of true positives captured as a function of the total instances considered. Values range from 0 (no positives captured) to 1 (all positives captured), and an initial 0 is inserted at the start to represent the baseline.
- Raises:
- ValueError
If
y_truedoes not contain exactly two distinct classes, indicating that the problem is not a binary classification task.If
pos_labelis not provided and cannot be inferred fromy_true, or ify_scoreis binary instead of continuous.If the positive class does not appear in
y_true, resulting in a gain of zero, which would mislead the user.
Notes
Binary Classification Only: This implementation is strictly for binary classification. Multi-class problems are not supported and will result in a
ValueError.Score Type: The
y_scorearray must contain continuous values. Binary scores (0/1) are not appropriate for plotting cumulative gain curves and will lead to incorrect results.Performance: The function sorts the scores, which contributes to a time complexity of O(n log n), where
nis the number of samples. For large datasets, this could be a performance bottleneck.Baseline Insertion: A starting point of (0, 0) is included in both the
percentagesandgainsarrays. This ensures that the cumulative gain curve starts at the origin, providing an accurate representation of the gain from zero instances considered.Handling Edge Cases: If
y_truecontains no instances of the positive class, the function will raise aValueError, as a cumulative gain curve would not be meaningful.
Examples
>>> from sklearn.datasets import make_classification
>>> from sklearn.linear_model import LogisticRegression
>>> from sklearn.model_selection import train_test_split
>>> import matplotlib.pyplot as plt
>>> # Generate a binary classification dataset
>>> X, y = make_classification(
...     n_samples=1000,
...     n_classes=2,
...     n_informative=3,
...     random_state=42,
... )
>>> # Split into training and test sets
>>> X_train, X_test, y_train, y_test = train_test_split(
...     X, y, test_size=0.3, random_state=42
... )
>>> # Train a logistic regression model
>>> model = LogisticRegression()
>>> model.fit(X_train, y_train)
>>> # Predict probabilities for the test set
>>> y_scores = model.predict_proba(X_test)[:, 1]
>>> # Calculate the cumulative gain curve
>>> import scikitplot as sp
>>> percentages, gains = sp.api._utils.cumulative_gain_curve(y_test, y_scores)
>>> # Plot the cumulative gain curve
>>> plt.plot(percentages, gains, marker='o')
>>> plt.xlabel('Percentage of Samples')
>>> plt.ylabel('Gain')
>>> plt.title('Cumulative Gain Curve')
>>> plt.grid()
>>> plt.show()
(
Source code,png)
