plot_elbow#
- scikitplot.api.estimators.plot_elbow(clf, X, *, cluster_ranges=None, show_cluster_time=True, n_jobs=1, title='Elbow Curves', title_fontsize='large', text_fontsize='medium', **kwargs)[source]#
Plot the elbow curve for different values of K in KMeans clustering.
- Parameters:
- clfobject
A clusterer instance with
fit,fit_predict, andscoremethods, and ann_clustershyperparameter. Typically an instance ofsklearn.cluster.KMeans.- Xarray-like of shape (n_samples, n_features)
The data to cluster, where
n_samplesis the number of samples andn_featuresis the number of features.- cluster_rangeslist of int or None, optional, default=range(1, 12, 2)
List of values for
n_clustersover which to plot the explained variances.- show_cluster_timebool, optional
Whether to include a plot of the time taken to cluster for each value of K.
- n_jobsint, optional, default=1
The number of jobs to run in parallel.
- titlestr, optional, default=”Elbow Plot”
The title of the generated plot.
- title_fontsizestr or int, optional, default=”large”
Font size of the title. Accepts Matplotlib font sizes, such as “small”, “medium”, “large”, or an integer value.
- text_fontsizestr or int, optional, default=”medium”
Font size of the text labels. Accepts Matplotlib font sizes, such as “small”, “medium”, “large”, or an integer value.
- **kwargs: dict
Generic keyword arguments.
- Returns:
- axmatplotlib.axes.Axes
The axes on which the plot was drawn.
- Other Parameters:
- axmatplotlib.axes.Axes, optional, default=None
The axis to plot the figure on. If None is passed in the current axes will be used (or generated if required).
Added in version 0.4.0.
- figmatplotlib.pyplot.figure, optional, default: None
The figure to plot the Visualizer on. If None is passed in the current plot will be used (or generated if required).
Added in version 0.4.0.
- figsizetuple, optional, default=None
Width, height in inches. Tuple denoting figure size of the plot e.g. (12, 5)
Added in version 0.4.0.
- nrowsint, optional, default=1
Number of rows in the subplot grid.
Added in version 0.4.0.
- ncolsint, optional, default=1
Number of columns in the subplot grid.
Added in version 0.4.0.
- plot_stylestr, optional, default=None
Check available styles with “plt.style.available”. Examples include: [‘ggplot’, ‘seaborn’, ‘bmh’, ‘classic’, ‘dark_background’, ‘fivethirtyeight’, ‘grayscale’, ‘seaborn-bright’, ‘seaborn-colorblind’, ‘seaborn-dark’, ‘seaborn-dark-palette’, ‘tableau-colorblind10’, ‘fast’].
Added in version 0.4.0.
- show_figbool, default=True
Show the plot.
Added in version 0.4.0.
- save_figbool, default=False
Save the plot. Used by
save_plot_decorator.Added in version 0.4.0.
- save_fig_filenamestr, optional, default=’’
Specify the path and filetype to save the plot. If nothing specified, the plot will be saved as png inside
result_imagesunder to the current working directory. Defaults to plot image named to usedfunc.__name__. Used bysave_plot_decorator.Added in version 0.4.0.
- overwritebool, optional, default=True
If False and a file exists, auto-increments the filename to avoid overwriting.
Added in version 0.4.0.
- add_timestampbool, optional, default=False
Whether to append a timestamp to the filename. Default is False.
Added in version 0.4.0.
- verbosebool, optional
If True, enables verbose output with informative messages during execution. Useful for debugging or understanding internal operations such as backend selection, font loading, and file saving status. If False, runs silently unless errors occur.
Default is False.
Added in version 0.4.0: The
verboseparameter was added to control logging and user feedback verbosity.
Examples
>>> from sklearn.cluster import KMeans
>>> from sklearn.datasets import load_iris as data_3_classes
>>> import scikitplot as skplt
>>> X, y = data_3_classes(return_X_y=True, as_frame=False)
>>> kmeans = KMeans(random_state=0)
>>> skplt.estimators.plot_elbow(
>>>     kmeans,
>>>     X,
>>>     cluster_ranges=range(1, 10),
>>> );
(
Source code,png)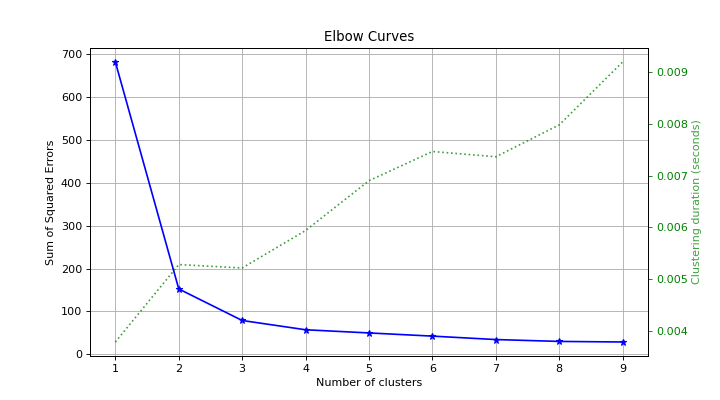