save_figure#
- scikitplot.api._utils.save_figure(figs, save_path='figures.png', figsize=None, dpi=100, to_save=True)[source]#
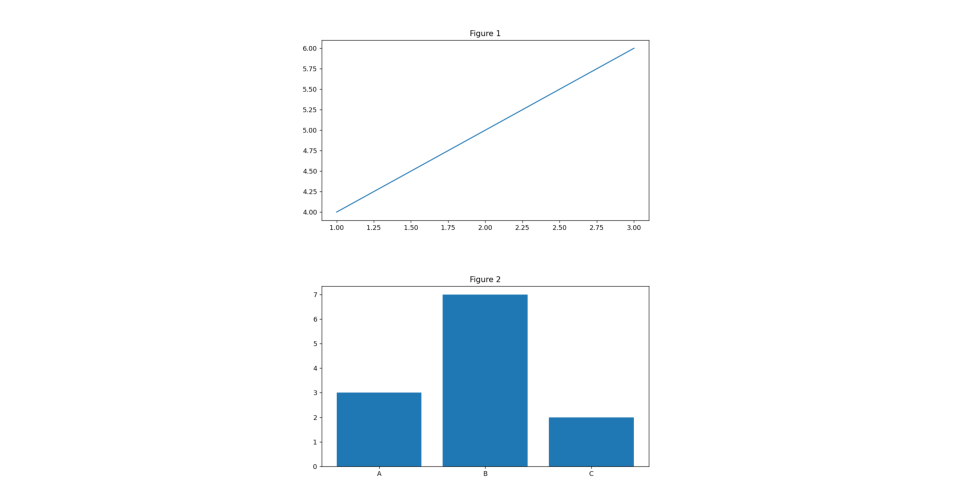
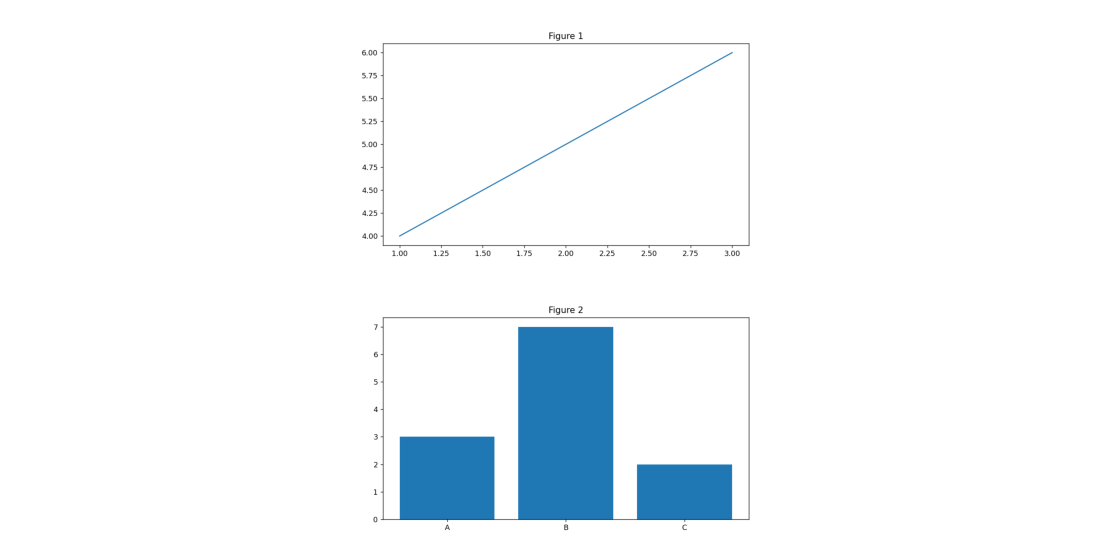
Combine multiple figures into a single image, save it (if specified), and return the combined figure.
- Parameters:
- figstuple of matplotlib.figure.Figure
Tuple containing the figures to be combined.
- save_pathstr, optional
Path where the combined figure image will be saved. Default is ‘combined_figure.png’.
- figsizetuple of two int or float, optional
Size of the combined figure (width, height) in inches. If None, defaults to (12, 3.15 * num_figures), where num_figures is the number of figures to combine. Default is None.
- dpiint, optional
Dots per inch (DPI) for the saved figure. Higher DPI results in better resolution. Default is 100.
- to_savebool, optional
Whether to save the combined figure to a file. If False, the figure is not saved. Default is True.
- Returns:
- combined_figmatplotlib.figure.Figure
The combined figure containing all the individual figures.
- Parameters:
figs (tuple)
Examples
>>> import matplotlib.pyplot as plt
>>> fig1, ax1 = plt.subplots()
>>> ax1.plot([1, 2, 3], [4, 5, 6])
>>> ax1.set_title('Figure 1')
>>> fig2, ax2 = plt.subplots()
>>> ax2.bar(['A', 'B', 'C'], [3, 7, 2])
>>> ax2.set_title('Figure 2')
>>> import scikitplot as sp
>>> # Save the combined figure with default figsize
>>> combined_fig = sp.api._utils.save_figure((fig1, fig2), 'output.png', dpi=150, to_save=True)
>>> # Combine figures without saving to a file and with custom figsize
>>> combined_fig = sp.api._utils.save_figure((fig1, fig2), dpi=150, to_save=False, figsize=(14, 7))


