save_plot#
- scikitplot.api._utils.save_plot(suffix=False, save_plots=False, output='result_images', debug=False)[source]#
Save the current plot if the environment variable to save plots is enabled.
This function checks if the environment variable ‘SKPLT_SAVE_PLOT’ is set. If it is, it saves the current plot to a specified directory, with a filename based on the current script name (or a given suffix).
- Parameters:
- suffixbool or str, optional, default=False
If
True, an incremental suffix (_000, _001, etc.) is appended to the filename. IfFalse, no suffix is added.- save_plotsbool, optional, default=False
A flag to control whether plots should be saved. This can override the environment variable.
- outputstr, optional, default=’result_images’
The name of the directory where the plots will be saved. The directory is created if it doesn’t exist.
- debugbool, optional, default=False
If True, prints the path where the plot is saved. Useful for debugging purposes.
- Returns:
- None
The function has no return value. It saves the plot to disk if conditions are met.
Notes
The function saves the plot as a PNG file with a filename based on the current script name, followed by the given suffix (if applicable). The file is saved in the specified output directory.
Examples
>>> import matplotlib.pyplot as plt
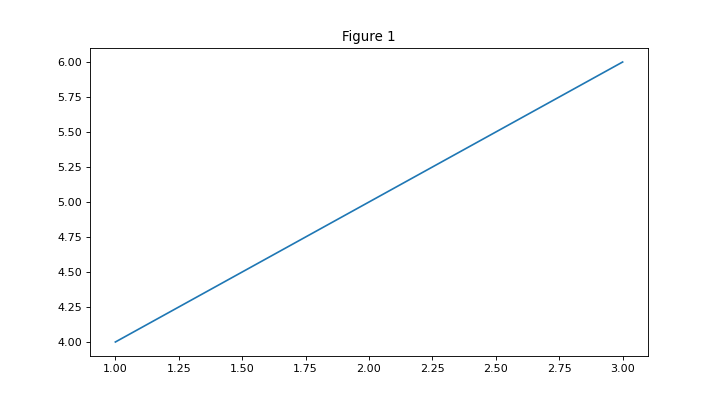
>>> fig1, ax1 = plt.subplots()
>>> ax1.plot([1, 2, 3], [4, 5, 6])
>>> ax1.set_title('Figure 1')
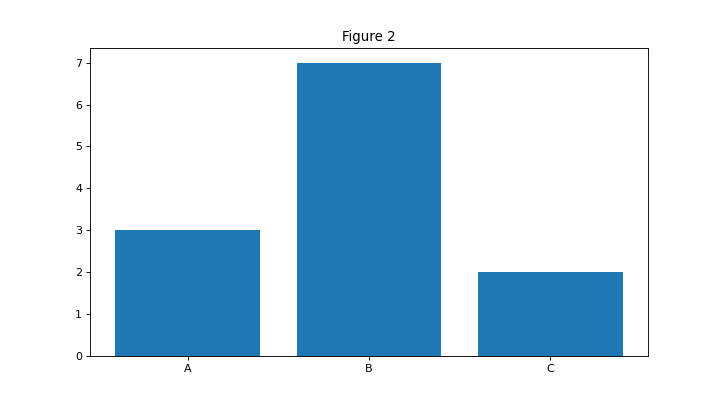
>>> fig2, ax2 = plt.subplots()
>>> ax2.bar(['A', 'B', 'C'], [3, 7, 2])
>>> ax2.set_title('Figure 2')
>>> import scikitplot as sp
>>> # Save the custam plot
>>> sp.api._utils.save_plot()


