tweedie#
- scikitplot.externals._tweedie.tweedie = <scikitplot.externals._tweedie._tweedie_dist.tweedie_gen object>[source]#
An instance of
tweedie_gen, providing Tweedie distribution functionality.This instance provides:
probability density function (pdf)
cumulative distribution function (cdf)
random sampling
for the Tweedie distribution.
The Tweedie distribution is part of the exponential dispersion family, characterized by a
pparameter that determines its behavior:p = 0: Gaussian distributionp = 1: Poisson distributionp = 2: Gamma distributionp = 3: Inverse Gaussian distribution1 < p < 2: Compound Poisson-Gamma distribution
- Parameters:
- pfloat
Tweedie power parameter.
- mufloat
Mean or location parameter.
- phifloat
Dispersion parameter, controlling the variance of the distribution.
See also
tweedie_genA Tweedie continuous random variable.
Examples
Compute the pdf and cdf at a given point:
>>> import numpy as np
>>> from scikitplot.stats import tweedie
>>> x = 2.0
>>> pdf_val = tweedie.pdf(x, p=1.5, mu=1, phi=1)
>>> cdf_val = tweedie.cdf(x, p=1.5, mu=1, phi=1)
>>> pdf_val, cdf_val
(np.float64(0.15640119832636348), np.float64(0.8519363569424107))
Generate random variates:
>>> import numpy as np
>>> from scikitplot.stats import tweedie
>>> rvs = tweedie.rvs(p=1.5, mu=1, phi=1, size=16)
>>> rvs
array([1.35105541, 1.32676564, 0.3669562 , 0.12745571, 3.07176717,
       2.11485912, 0.30533759, 0.62918051, 0.        , 1.32477118,
       0.        , 1.01263113, 0.79398813, 0.02913184, 0.66001509,
       0.49155455])
Plot the pdf over a range:
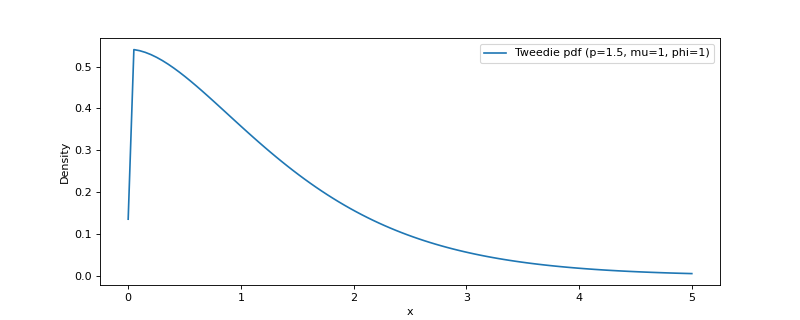
>>> import numpy as np
>>> from scikitplot.stats import tweedie
>>> import matplotlib.pyplot as plt
>>> x = np.linspace(0, 5, 100)
>>> y = tweedie.pdf(x, p=1.5, mu=1, phi=1)
>>> plt.plot(x, y, label='Tweedie pdf (p=1.5, mu=1, phi=1)')
>>> plt.xlabel("x")
>>> plt.ylabel("Density")
>>> plt.legend()
>>> plt.show()
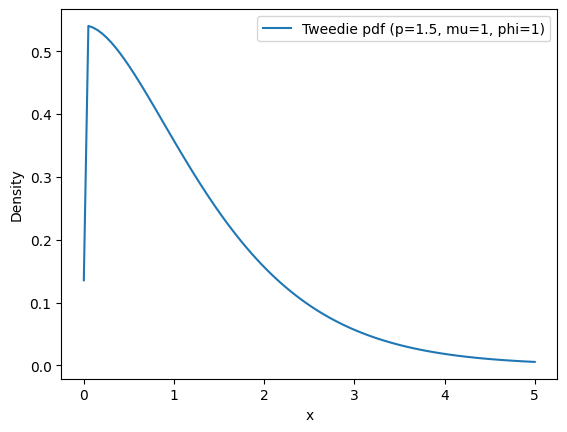
(
Source code,png)