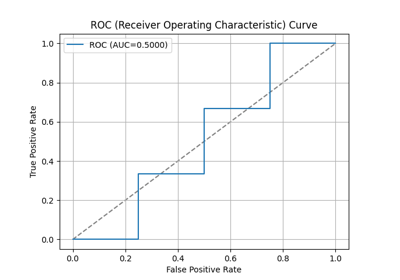
aucplot#
- scikitplot.snsx.aucplot(data=None, *, x=None, y=None, hue=None, kind=None, weights=None, hue_order=None, hue_norm=None, palette=None, color=None, fill=False, baseline=False, line_kws=None, log_scale=None, legend=True, ax=None, annot=None, fmt='.4g', annot_kws=None, digits=None, common_norm=None, verbose=False, **kwargs)[source]#
Plot PR or ROC curves with a seaborn-like API.
- Parameters:
- data
pandas.DataFrame,numpy.ndarray, mapping, or sequence Input data structure. Either a long-form collection of vectors that can be assigned to named variables or a wide-form dataset that will be internally reshaped.
- x, yvectors or keys in
data Variables that specify positions on the x and y axes.
- huevector or key in
data Semantic variable that is mapped to determine the color of plot elements.
- kind{‘pr’, ‘roc’} or None, default=None
Kind of plot to make.
if
'pr', the plot is pr curve;if
'roc', the plot is roc curve;if
None, the plot is roc curve.
- weightsvector or key in
data If provided, observation weights used for computing the distribution function.
- hue_ordervector of strings
Specify the order of processing and plotting for categorical levels of the
huesemantic.- hue_normtuple or
matplotlib.colors.Normalize Either a pair of values that set the normalization range in data units or an object that will map from data units into a [0, 1] interval. Usage implies numeric mapping.
- palettestring, list, dict, or
matplotlib.colors.Colormap Method for choosing the colors to use when mapping the
huesemantic. String values are passed tocolor_palette. List or dict values imply categorical mapping, while a colormap object implies numeric mapping.- color
matplotlib color Single color specification for when hue mapping is not used. Otherwise, the plot will try to hook into the matplotlib property cycle.
- fillbool or None
If True, fill in the area under univariate density curves or between bivariate contours. If None, the default depends on
multiple.- {line}_kwsdictionaries
Additional keyword arguments to pass to
plt.plot.- log_scalebool or number, or pair of bools or numbers
Set axis scale(s) to log. A single value sets the data axis for any numeric axes in the plot. A pair of values sets each axis independently. Numeric values are interpreted as the desired base (default 10). When
NoneorFalse, seaborn defers to the existing Axes scale.- legendbool
If False, suppress the legend for semantic variables.
- ax
matplotlib.axes.Axes Pre-existing axes for the plot. Otherwise, call
matplotlib.pyplot.gcainternally.- digitsint, optional, default=4
Number of digits for formatting output floating point values. When
output_dictisTrue, this will be ignored and the returned values will not be rounded.- output_dictbool, default=False
If True, return output as dict.
- zero_division{“warn”, 0.0, 1.0, np.nan}, default=”warn”
Sets the value to return when there is a zero division. If set to “warn”, this acts as 0, but warnings are also raised.
- common_normbool
If True, scale each conditional density by the number of observations such that the total area under all densities sums to 1. Otherwise, normalize each density independently.
- verbosebool, optional, default=False
Whether to be verbose.
- kwargs
Other keyword arguments are passed to one of the following matplotlib functions:
- data
- Returns:
matplotlib.axes.AxesThe matplotlib axes containing the plot.
Warning
- Some function parameters are experimental prototypes.
- These may be modified, renamed, or removed in future library versions.
- Use with caution and check documentation for the latest updates.
- Parameters:
- Return type:
See also
Notes
For PR curves, the score displayed as
AUCis Average Precision (AP).