kdsplot#
- scikitplot.snsx.kdsplot(data=None, *, x=None, y=None, kind=None, n_deciles=10, round_digits=None, hue=None, weights=None, verbose=False, fill=False, line_kws=None, color=None, legend=True, ax=None, **kwargs)[source]#
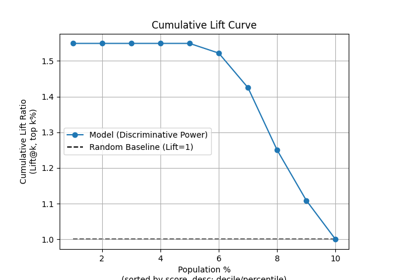
Given binary labels y_true (0/1) and probabilities y_score 1d array, compute/plot a decile table.
The function sorts observations by descending score, assigns decile index (1..n_deciles) using pandas qcut on the rank/index to ensure near-equal bins, and computes standard decile-level stats (features):
[
    "decile",
    "prob_min",
    "prob_max",
    "prob_avg",
    "cnt_resp_total",
    "cnt_resp",
    "cnt_resp_non",
    "cnt_resp_rndm",
    "cnt_resp_wiz",
    "rate_resp",  # (alias to decile_wise_response, decile_wise_gain)
    "cum_resp_total",
    "cum_resp_total_pct",
    "cum_resp",  #  (alias to cumulative_gain)
    "cum_resp_pct",
    "cum_resp_non",
    "cum_resp_non_pct",
    "cum_resp_rndm",
    "cum_resp_rndm_pct",
    "cum_resp_wiz",
    "cum_resp_wiz_pct",
    "KS",
    "cumulative_lift",
    "decile_wise_lift",
]
- Parameters:
- datapandas.DataFrame | None
- xstr | pd.Series | np.ndarray | None
Ground truth (correct/actual) target values.
- ystr | pd.Series | np.ndarray | None
Prediction probabilities for target class returned by a classifier/algorithm.
- n_decilesint, optional, default=10
The number of partitions for creating the table. Defaults to 10 for deciles.
- round_digitsint, optional, default=None
The decimal precision for the result. return df.round(round_digits)
- verbosebool, optional, default=False
If True, prints a legend for the abbreviations of decile table column names.
- Returns:
- pandas.DataFrame | matplotlib.axes.Axes
The dataframe (decile-table) with the indexed by deciles (sorted ascending) and related information (decile-level metrics). If hue/facet semantics were used, the returned table will include extra columns for those keys (e.g., ‘hue’).
- Parameters:
- Return type: