plot_ks_statistic#
- scikitplot.deciles.plot_ks_statistic(y_true, y_probas, *, class_index=1, title='KS Statistic Plot', ax=None, fig=None, figsize=None, title_fontsize='large', text_fontsize='medium', digits=2, **kwargs)#
Generates the KS Statistic plot from labels and scores/probabilities.
Kolmogorov-Smirnov (KS) statistic is used to measure how well the binary classifier model separates the Responder class (Yes) from Non-Responder class (No). The range of K-S statistic is between 0 and 1. Higher the KS statistic value better the model in separating the Responder class from Non-Responder class.
- Parameters:
y_true (array-like, shape (n_samples)) – Ground truth (correct) target values.
y_probas (array-like, shape (n_samples, n_classes)) – Prediction probabilities for each class returned by a classifier.
title (str, optional, default='KS Statistic Plot') – Title of the generated plot.
ax (list of matplotlib.axes.Axes, optional, default=None) – The axis to plot the figure on. If None is passed in the current axes will be used (or generated if required). Axes like
fig.add_subplot(1, 1, 1)orplt.gca()fig (matplotlib.pyplot.figure, optional, default: None) –
The figure to plot the Visualizer on. If None is passed in the current plot will be used (or generated if required).
Added in version 0.3.9.
figsize (tuple of 2 ints, optional) – Tuple denoting figure size of the plot e.g. (6, 6). Defaults to None.
title_fontsize (str or int, optional) – Matplotlib-style fontsizes. Use e.g. “small”, “medium”, “large” or integer-values. Defaults to “large”.
text_fontsize (str or int, optional) – Matplotlib-style fontsizes. Use e.g. “small”, “medium”, “large” or integer-values. Defaults to “medium”.
digits (int, optional) –
Number of digits for formatting output floating point values. Use e.g. 2 or 4. Defaults to 2.
Added in version 0.3.9.
- Returns:
The axes on which the plot was drawn.
- Return type:
Examples
>>> from sklearn.datasets import load_breast_cancer as data_2_classes
>>> from sklearn.model_selection import train_test_split
>>> from sklearn.linear_model import LogisticRegression
>>> import scikitplot as skplt
>>> X, y = data_2_classes(return_X_y=True, as_frame=False)
>>> X_train, X_val, y_train, y_val = train_test_split(X, y, test_size=0.5, random_state=0)
>>> model = LogisticRegression(max_iter=int(1e5), random_state=0).fit(X_train, y_train)
>>> y_probas = model.predict_proba(X_val)
>>> skplt.deciles.plot_ks_statistic(
>>>     y_val, y_probas,
>>> );
(
Source code,png)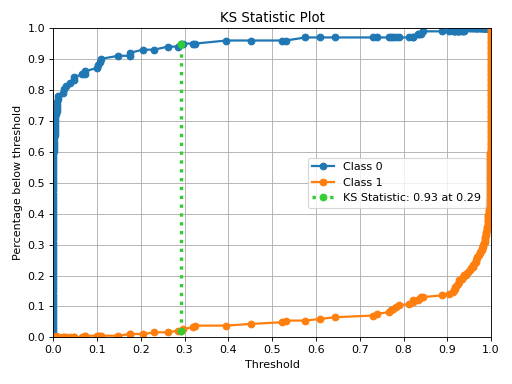