plot_pca_2d_projection#
- scikitplot.decomposition.plot_pca_2d_projection(clf, X, y, title='PCA 2-D Projection', ax=None, figsize=None, title_fontsize='large', text_fontsize='medium', cmap='Spectral', biplot=False, feature_labels=None, dimensions=[0, 1], label_dots=False)#
Plots the 2-dimensional projection of PCA on a given dataset.
- Parameters:
clf (object) – Fitted PCA instance that can
transformgiven data set into 2 dimensions.X (array-like, shape (n_samples, n_features)) – Feature set to project, where n_samples is the number of samples and n_features is the number of features.
y (array-like, shape (n_samples) or (n_samples, n_features)) – Target relative to X for labeling.
title (str, optional, default='PCA 2-D Projection') – Title of the generated plot.
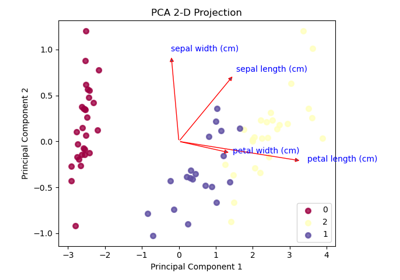
biplot (bool, optional, default=False) – If True, the function will generate and plot biplots. If False, the biplots are not generated.
feature_labels (array-like, shape (n_features), optional, default=None) – List of labels that represent each feature of X. Its index position must also be relative to the features. If None is given, labels will be automatically generated for each feature (e.g. “variable1”, “variable2”, “variable3” …).
ax (matplotlib.axes.Axes, optional, default=None) – The axes upon which to plot. If None, a new set of axes is created.
figsize (tuple of int, optional, default=None) – Size of the figure (width, height) in inches.
title_fontsize (str or int, optional, default='large') – Font size for the plot title.
text_fontsize (str or int, optional, default='medium') – Font size for the text in the plot.
cmap (str or matplotlib.colors.Colormap, optional, default='viridis') – Colormap used for plotting the projection. See Matplotlib Colormap documentation for available options: https://matplotlib.org/users/colormaps.html
- Returns:
The axes on which the plot was drawn.
- Return type:
Examples
>>> from sklearn.decomposition import PCA
>>> from sklearn.datasets import load_iris as data_3_classes
>>> import scikitplot as skplt
>>> X, y = data_3_classes(return_X_y=True, as_frame=False)
>>> pca = PCA(random_state=0).fit(X)
>>> skplt.decomposition.plot_pca_2d_projection(pca, X, y);
(
Source code,png)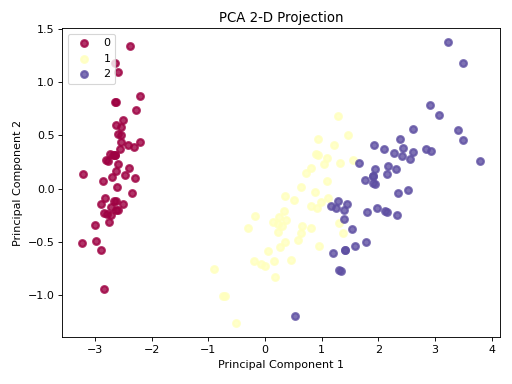