plot_learning_curve#
- scikitplot.estimators.plot_learning_curve(estimator, X, y, *, train_sizes=None, cv=None, scoring=None, n_jobs=None, verbose=0, shuffle=False, random_state=None, fit_params=None, title='Learning Curves', ax=None, fig=None, figsize=None, title_fontsize='large', text_fontsize='medium', **kwargs)#
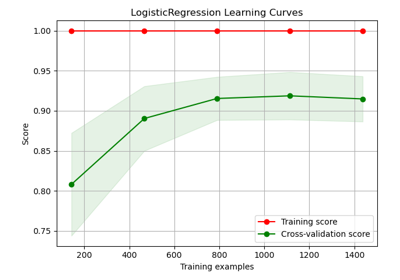
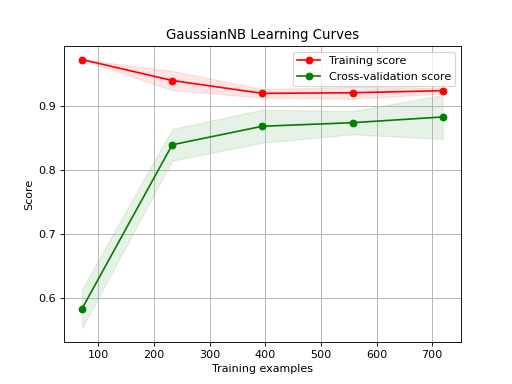
Generates a plot of the train and test learning curves for a classifier.
The learning curves plot the performance of a classifier as a function of the number of training samples. This helps in understanding how well the classifier performs with different amounts of training data.
- Parameters:
estimator (object type that implements the "fit" method) – An object of that type which is cloned for each validation. It must also implement “predict” unless
scoringis a callable that doesn’t rely on “predict” to compute a score.X (array-like, shape (n_samples, n_features)) – Training data, where
n_samplesis the number of samples andn_featuresis the number of features.y (array-like, shape (n_samples,) or (n_samples, n_features), optional) – Target relative to
Xfor classification or regression. None for unsupervised learning.train_sizes (iterable, optional) – Determines the training sizes used to plot the learning curve. If None,
np.linspace(.1, 1.0, 5)is used.cv (int, cross-validation generator, iterable or None, default=5) –
Determines the cross-validation splitting strategy. Possible inputs for cv are: - None, to use the default 5-fold cross validation, - integer, to specify the number of folds. - CV splitter, - An iterable that generates (train, test) splits as arrays of indices.
For integer/None inputs, if classifier is True and
yis either binary or multiclass,StratifiedKFoldis used. In all other cases,KFoldis used.Refer User Guide for the various cross-validation strategies that can be used here.
scoring (str, callable, or None, optional, default=None) – A string (see scikit-learn model evaluation documentation) or a scorer callable object/function with signature
scorer(estimator, X, y).n_jobs (int, optional, default=None) – Number of jobs to run in parallel. Training the estimator and computing the score are parallelized over the different training and test sets.
Nonemeans 1 unless in ajoblib.parallel_backendcontext.-1means using all processors. See Glossary for more details.verbose (int, default=0) – Controls the verbosity: the higher, the more messages.
shuffle (bool, optional, default=True) – Whether to shuffle the training data before splitting using cross-validation.
random_state (int or RandomState, optional) – Pseudo-random number generator state used for random sampling.
fit_params (dict, default=None) –
Parameters to pass to the fit method of the estimator.
Added in version 0.3.9.
title (str, optional, default="Learning Curves") – Title of the generated plot.
ax (matplotlib.axes.Axes, optional, default=None) – The axis to plot the figure on. If None is passed in the current axes will be used (or generated if required).
fig (matplotlib.pyplot.figure, optional, default: None) – The figure to plot the Visualizer on. If None is passed in the current plot will be used (or generated if required).
figsize (tuple of int, optional, default=None) – Tuple denoting figure size of the plot, e.g., (6, 6).
title_fontsize (str or int, optional, default='large') – Font size for the plot title. Use e.g., “small”, “medium”, “large” or integer values.
text_fontsize (str or int, optional, default='medium') – Font size for the text in the plot. Use e.g., “small”, “medium”, “large” or integer values.
kwargs (dict) – generic keyword arguments.
- Returns:
The axes on which the plot was drawn.
- Return type:
References#
Examples
>>> from sklearn.datasets import load_digits as data_10_classes
>>> from sklearn.model_selection import train_test_split
>>> from sklearn.naive_bayes import GaussianNB
>>> import scikitplot as skplt
>>> X, y = data_10_classes(return_X_y=True, as_frame=False)
>>> X_train, X_val, y_train, y_val = train_test_split(X, y, test_size=0.5, random_state=0)
>>> model = GaussianNB()
>>> model.fit(X_train, y_train)
>>> y_val_pred = model.predict(X_val)
>>> skplt.estimators.plot_learning_curve(
>>>     model, X_val, y_val_pred,
>>> );
(
Source code,png)