plot_feature_importances#
- scikitplot.estimators.plot_feature_importances(estimator, *, feature_names=None, class_index=None, threshold=None, title='Feature Importances', ax=None, fig=None, figsize=None, title_fontsize='large', text_fontsize='medium', cmap='PiYG', order=None, orientation='vertical', x_tick_rotation=None, bar_padding=11, display_bar_label=True, digits=4, **kwargs)#
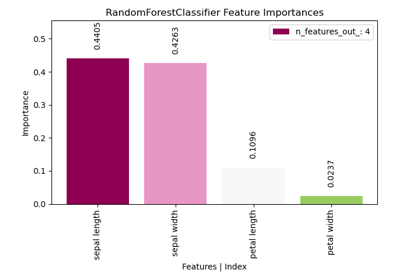
Generates a plot of a sklearn model’s feature importances.
This function handles different types of classifiers and their respective feature importances (
feature_importances_) or coefficient (coef_) attributes, if not provide its compute sklearn permutation importances. It supports models wrapped in pipelines.- Supports models like:
- Parameters:
estimator (estimator object) – Fitted classifier or a fitted
Pipelinein which the last estimator is a classifier.feature_names (list of str, optional, default=None) – List of feature names corresponding to the features. If None, feature indices are used.
class_index (int, optional, default=None) – Index of the class of interest for multi-class classification. Defaults to None.
threshold (float, optional, default=None) – Threshold for filtering features by absolute importance. Only features with an absolute importance greater than this threshold will be plotted. Defaults to None (plot all features).
title (str, optional, default='Feature Importances') – Title of the generated plot.
ax (matplotlib.axes.Axes, optional, default=None) – The axis to plot the figure on. If None is passed in the current axes will be used (or generated if required).
fig (matplotlib.pyplot.figure, optional, default: None) – The figure to plot the Visualizer on. If None is passed in the current plot will be used (or generated if required).
figsize (tuple, optional, default=None) – Tuple denoting figure size of the plot e.g. (6, 6)
title_fontsize (str or int, optional, default='large') – Matplotlib-style fontsizes. Use e.g. “small”, “medium”, “large” or integer-values.
text_fontsize (str or int, optional, default='medium') – Matplotlib-style fontsizes. Use e.g. “small”, “medium”, “large” or integer-values.
cmap (None, str or matplotlib.colors.Colormap, optional, default='PiYG') – Colormap used for plotting. Options include ‘viridis’, ‘PiYG’, ‘plasma’, ‘inferno’, etc. See Matplotlib Colormap documentation for available choices. - https://matplotlib.org/stable/users/explain/colors/index.html
order ({'ascending', 'descending', None}, optional, default=None) – Order of feature importance in the plot. Defaults to None (automatically set based on orientation).
orientation ({'vertical' | 'v' | 'y', 'horizontal' | 'h' | 'y'}, optional) – Orientation of the bar plot. Defaults to ‘vertical’.
x_tick_rotation (int, optional, default=None) – Rotates x-axis tick labels by the specified angle. Defaults to None (automatically set based on orientation).
bar_padding (float, optional, default=11) – Padding between bars in the plot.
display_bar_label (bool, optional, default=True) – Whether to display the bar labels.
digits (int, optional, default=4) –
Number of digits for formatting AUC values in the plot.
Added in version 0.3.9.
- Returns:
ax – The axes on which the plot was drawn.
- Return type:
Examples
>>> from sklearn.datasets import load_digits as data_10_classes
>>> from sklearn.model_selection import train_test_split
>>> from sklearn.ensemble import RandomForestClassifier
>>> import scikitplot as skplt
>>> X, y = data_10_classes(return_X_y=True, as_frame=False)
>>> X_train, X_val, y_train, y_val = train_test_split(X, y, test_size=0.5, random_state=0)
>>> model = RandomForestClassifier(random_state=0).fit(X_train, y_train)
>>> skplt.estimators.plot_feature_importances(
>>>     model,
>>>     orientation='y',
>>>     figsize=(11, 5),
>>> );
(
Source code,png)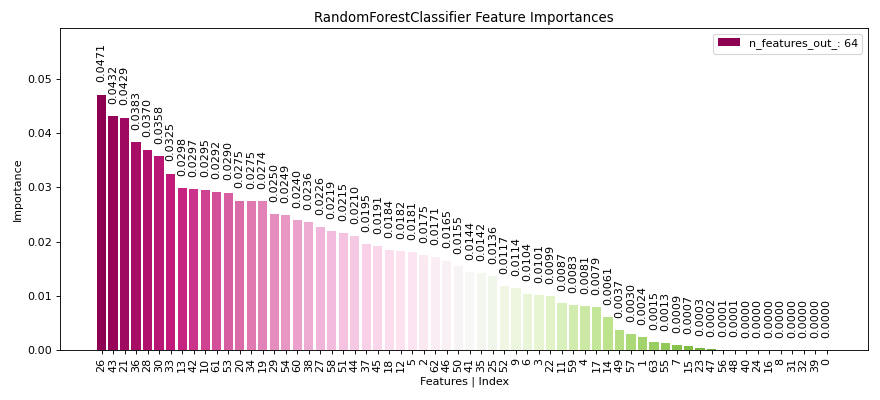