plot_confusion_matrix#
- scikitplot.metrics.plot_confusion_matrix(y_true, y_pred, labels=None, true_labels=None, pred_labels=None, title=None, normalize=False, hide_zeros=False, hide_counts=False, x_tick_rotation=0, ax=None, figsize=None, cmap='Blues', title_fontsize='large', text_fontsize='medium', show_colorbar=True)#
Generates a confusion matrix plot from predictions and true labels.
The confusion matrix is a summary of prediction results that shows the counts of true and false positives and negatives for each class. This function also provides options for normalizing, hiding zero values, and customizing the plot appearance.
- Parameters:
y_true (array-like, shape (n_samples,)) – Ground truth (correct) target values.
y_pred (array-like, shape (n_samples,)) – Estimated targets as returned by a classifier.
labels (array-like, shape (n_classes), optional) – List of labels to index the matrix. This may be used to reorder or select a subset of labels. If None, labels appearing at least once in
y_trueory_predare used in sorted order. (new in v0.2.5)true_labels (array-like, optional) – The true labels to display. If None, all labels are used.
pred_labels (array-like, optional) – The predicted labels to display. If None, all labels are used.
title (string, optional) – Title of the generated plot. Defaults to “Confusion Matrix” if
normalizeis True. Otherwise, defaults to “Normalized Confusion Matrix”.normalize (bool, optional, default=False) – If True, normalizes the confusion matrix before plotting.
hide_zeros (bool, optional, default=False) – If True, cells containing a value of zero are not plotted.
hide_counts (bool, optional, default=False) – If True, counts are not overlaid on the plot.
x_tick_rotation (int, optional, default=0) – Rotates x-axis tick labels by the specified angle. Useful when labels overlap.
ax (matplotlib.axes.Axes, optional) – The axes upon which to plot the confusion matrix. If None, a new set of axes is created. Axes like
fig.add_subplot(1, 1, 1)orplt.gca()figsize (tuple of int, optional) – Tuple denoting figure size of the plot, e.g., (6, 6). Defaults to None.
cmap (None, str, or matplotlib.colors.Colormap, optional, default='viridis') – Colormap used for plotting. Options include ‘viridis’, ‘plasma’, ‘inferno’, etc. Refer to the Matplotlib Colormap documentation for available choices.
title_fontsize (string or int, optional, default="large") – Font size for the plot title. Use “small”, “medium”, “large”, or integer values.
text_fontsize (string or int, optional, default="medium") – Font size for text in the plot. Use “small”, “medium”, “large”, or integer values.
show_colorbar (bool, optional, default=True) –
If False, the colorbar is not displayed.
Added in version 0.3.9.
- Returns:
ax – The axes on which the plot was drawn.
- Return type:
Notes
Ensure that
y_trueandy_predhave the same shape and contain valid class labels. Thenormalizeparameter applies only to the confusion matrix plot. Adjustcmapandx_tick_rotationto customize the appearance of the plot. Theshow_colorbarparameter controls whether a colorbar is displayed.Examples
>>> from sklearn.datasets import load_digits as data_10_classes
>>> from sklearn.model_selection import train_test_split
>>> from sklearn.naive_bayes import GaussianNB
>>> import scikitplot as skplt
>>> X, y = data_10_classes(return_X_y=True, as_frame=False)
>>> X_train, X_val, y_train, y_val = train_test_split(X, y, test_size=0.5, random_state=0)
>>> model = GaussianNB()
>>> model.fit(X_train, y_train)
>>> y_val_pred = model.predict(X_val)
>>> skplt.metrics.plot_confusion_matrix(
>>>     y_val, y_val_pred,
>>> );
(
Source code,png)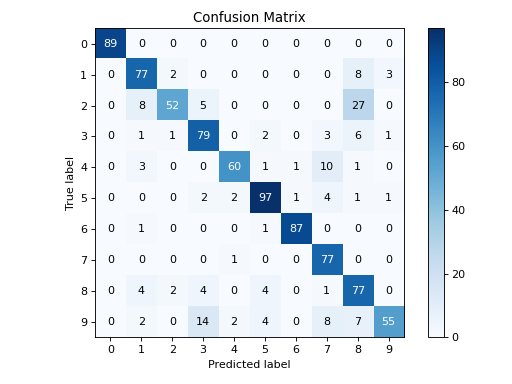