report#
- scikitplot.kds.report(y_true, y_probas, *, pos_label=None, class_index=1, display_term_tables=True, digits=3, title_fontsize='large', text_fontsize='medium', plot_style=None, figsize=(10, 5), nrows=2, ncols=2, data=None, **kwargs)[source]#
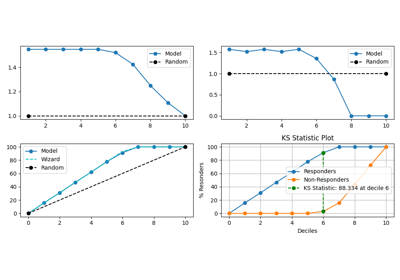
Generates a decile table and four plots:
Lift->plot_liftLift@Decile->plot_lift_decile_wiseGain->plot_cumulative_gainKS->plot_ks_statistic
from labels and probabilities.
- Parameters:
- y_truearray-like, shape (n_samples,)
Ground truth (correct) target values.
- y_probasarray-like, shape (n_samples, n_classes)
Prediction probabilities for each class returned by a classifier.
- class_indexint, optional, default=1
Index of the class of interest for multi-class classification. Ignored for binary classification.
- labelsbool, optional, default=True
If True, prints a legend for the abbreviations of decile table column names.
Deprecated since version 0.3.9: This parameter is deprecated and will be removed in version 0.5.0. Use
display_term_tablesinstead.- display_term_tablesbool, optional, default=True
If True, prints a legend for the abbreviations of decile table column names.
Added in version 0.3.9.
- title_fontsizestr or int, optional, default=’large’
Font size for the plot title. Use e.g., “small”, “medium”, “large” or integer-values.
- text_fontsizestr or int, optional, default=’medium’
Font size for the text in the plot. Use e.g., “small”, “medium”, “large” or integer-values.
- digitsint, optional, default=3
Number of digits for formatting output floating point values. Use e.g., 2 or 4.
Added in version 0.3.9.
- **kwargsdict, optional
Generic keyword arguments.
- Returns:
- pandas.DataFrame
The dataframe containing the decile table with the deciles and related information.
- Other Parameters:
- axmatplotlib.axes.Axes, optional, default=None
The axis to plot the figure on. If None is passed in the current axes will be used (or generated if required).
Added in version 0.4.0.
- figmatplotlib.pyplot.figure, optional, default: None
The figure to plot the Visualizer on. If None is passed in the current plot will be used (or generated if required).
Added in version 0.4.0.
- figsizetuple, optional, default=None
Width, height in inches. Tuple denoting figure size of the plot e.g. (12, 5)
Added in version 0.4.0.
- nrowsint, optional, default=1
Number of rows in the subplot grid.
Added in version 0.4.0.
- ncolsint, optional, default=1
Number of columns in the subplot grid.
Added in version 0.4.0.
- plot_stylestr, optional, default=None
Check available styles with “plt.style.available”. Examples include: [‘ggplot’, ‘seaborn’, ‘bmh’, ‘classic’, ‘dark_background’, ‘fivethirtyeight’, ‘grayscale’, ‘seaborn-bright’, ‘seaborn-colorblind’, ‘seaborn-dark’, ‘seaborn-dark-palette’, ‘tableau-colorblind10’, ‘fast’].
Added in version 0.4.0.
- show_figbool, default=True
Show the plot.
Added in version 0.4.0.
- save_figbool, default=False
Save the plot.
Added in version 0.4.0.
- save_fig_filenamestr, optional, default=’’
Specify the path and filetype to save the plot. If nothing specified, the plot will be saved as png inside
result_imagesunder to the current working directory. Defaults to plot image named to usedfunc.__name__.Added in version 0.4.0.
- overwritebool, optional, default=True
If False and a file exists, auto-increments the filename to avoid overwriting.
Added in version 0.4.0.
- add_timestampbool, optional, default=False
Whether to append a timestamp to the filename. Default is False.
Added in version 0.4.0.
- verbosebool, optional
If True, enables verbose output with informative messages during execution. Useful for debugging or understanding internal operations such as backend selection, font loading, and file saving status. If False, runs silently unless errors occur.
Default is False.
Added in version 0.4.0: The
verboseparameter was added to control logging and user feedback verbosity.
See also
print_labelsA legend for the abbreviations of decile table column names.
decile_tableGenerates the Decile Table from labels and probabilities.
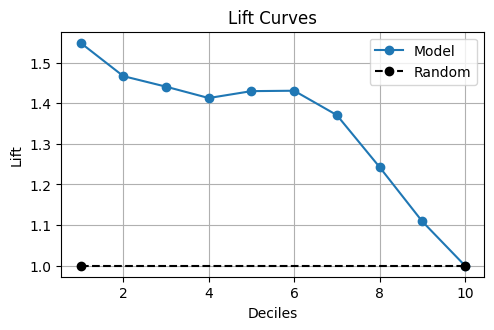
plot_liftGenerates the Decile based cumulative Lift Plot from labels and probabilities.
plot_lift_decile_wiseGenerates the Decile-wise Lift Plot from labels and probabilities.
plot_cumulative_gainGenerates the cumulative Gain Plot from labels and probabilities.
plot_ks_statisticGenerates the Kolmogorov-Smirnov (KS) Statistic Plot from labels and probabilities.
References
[1] tensorbored/kds
Examples
>>> from sklearn.datasets import (
...     load_breast_cancer as data_2_classes,
... )
>>> from sklearn.model_selection import train_test_split
>>> from sklearn.tree import DecisionTreeClassifier
>>> import scikitplot as skplt
>>> X, y = data_2_classes(return_X_y=True, as_frame=True)
>>> X_train, X_test, y_train, y_test = train_test_split(
...     X, y, test_size=0.5, random_state=0
... )
>>> clf = DecisionTreeClassifier(max_depth=1, random_state=0).fit(
...     X_train, y_train
... )
>>> y_prob = clf.predict_proba(X_test)
>>> dt = skplt.kds.report(
>>>     y_test, y_prob, class_index=1
>>> )
>>> dt
LABELS INFO:

 prob_min         : Minimum probability in a particular decile
 prob_max         : Minimum probability in a particular decile
 prob_avg         : Average probability in a particular decile
 cnt_events       : Count of events in a particular decile
 cnt_resp         : Count of responders in a particular decile
 cnt_non_resp     : Count of non-responders in a particular decile
 cnt_resp_rndm    : Count of responders if events assigned randomly in a particular decile
 cnt_resp_wiz     : Count of best possible responders in a particular decile
 resp_rate        : Response Rate in a particular decile [(cnt_resp/cnt_cust)*100]
 cum_events       : Cumulative sum of events decile-wise
 cum_resp         : Cumulative sum of responders decile-wise
 cum_resp_wiz     : Cumulative sum of best possible responders decile-wise
 cum_non_resp     : Cumulative sum of non-responders decile-wise
 cum_events_pct   : Cumulative sum of percentages of events decile-wise
 cum_resp_pct     : Cumulative sum of percentages of responders decile-wise
 cum_resp_pct_wiz : Cumulative sum of percentages of best possible responders decile-wise
 cum_non_resp_pct : Cumulative sum of percentages of non-responders decile-wise
 KS               : KS Statistic decile-wise
 lift             : Cumuative Lift Value decile-wise
decile prob_min prob_max prob_avg cnt_cust cnt_resp cnt_non_resp cnt_resp_rndm cnt_resp_wiz resp_rate cum_cust cum_resp cum_resp_wiz cum_non_resp cum_cust_pct cum_resp_pct cum_resp_pct_wiz cum_non_resp_pct KS lift 0 1 0.923 0.923 0.923 29.0 29.0 0.0 18.4 29 100.000 29.0 29.0 29 0.0 10.175 15.761 15.761 0.000 15.761 1.549 1 2 0.923 0.923 0.923 28.0 25.0 3.0 18.4 28 89.286 57.0 54.0 57 3.0 20.000 29.348 30.978 2.970 26.378 1.467 2 3 0.923 0.923 0.923 29.0 26.0 3.0 18.4 29 89.655 86.0 80.0 86 6.0 30.175 43.478 46.739 5.941 37.537 1.441 3 4 0.923 0.923 0.923 28.0 24.0 4.0 18.4 28 85.714 114.0 104.0 114 10.0 40.000 56.522 61.957 9.901 46.621 1.413 4 5 0.923 0.923 0.923 29.0 28.0 1.0 18.4 29 96.552 143.0 132.0 143 11.0 50.175 71.739 77.717 10.891 60.848 1.430 5 6 0.923 0.923 0.923 28.0 26.0 2.0 18.4 28 92.857 171.0 158.0 171 13.0 60.000 85.870 92.935 12.871 72.999 1.431 6 7 0.049 0.923 0.833 29.0 19.0 10.0 18.4 13 65.517 200.0 177.0 184 23.0 70.175 96.196 100.000 22.772 73.424 1.371 7 8 0.049 0.049 0.049 28.0 6.0 22.0 18.4 0 21.429 228.0 183.0 184 45.0 80.000 99.457 100.000 44.554 54.903 1.243 8 9 0.049 0.049 0.049 29.0 1.0 28.0 18.4 0 3.448 257.0 184.0 184 73.0 90.175 100.000 100.000 72.277 27.723 1.109 9 10 0.049 0.049 0.049 28.0 0.0 28.0 18.4 0 0.000 285.0 184.0 184 101.0 100.000 100.000 100.000 100.000 0.000 1.000