plot_cumresponse#
- scikitplot.modelplotpy.plot_cumresponse(plot_input, *, highlight_ntile=None, highlight_how='plot_text', save_fig=True, save_fig_filename='', **kwargs)[source]#
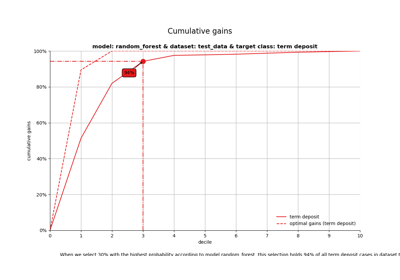
Plotting cumulative response curve
- Parameters:
- plot_inputpandas.DataFrame
The result from scope_modevalplot().
- highlight_ntileint or None, optional, default=None
Highlight the value of the response curve at a specified ntile value.
Changed in version 0.3.9: Default changed from False to None.
- highlight_how{‘plot’,’text’,’plot_text’}, optional, default=’plot_text’
Highlight_how specifies where information about the model performance is printed. It can be shown as text, on the plot or both.
- **kwargsdict, optional
Generic keyword arguments.
- Returns:
- matplotlib.axes._subplots.AxesSubplot
It returns a matplotlib.axes._subplots.AxesSubplot object that can be transformed into the same plot with the .figure command. The plot is by default written to disk (save_fig = True). The location and filetype of the file depend on the save_fig_filename parameter. If the save_fig_filename parameter is empty (not specified), the plot will be written to the working directory as png. Otherwise the location and file type is specified by the user.
- Other Parameters:
- show_figbool, default=True
Show the plot.
Added in version 0.4.0.
- save_figbool, default=False
Save the plot.
Added in version 0.4.0.
- save_fig_filenamestr, optional, default=’’
Specify the path and filetype to save the plot. If nothing specified, the plot will be saved as png inside
result_imagesunder to the current working directory. Defaults to plot image named to usedfunc.__name__.Added in version 0.4.0.
- overwritebool, optional, default=True
If False and a file exists, auto-increments the filename to avoid overwriting.
Added in version 0.4.0.
- add_timestampbool, optional, default=False
Whether to append a timestamp to the filename. Default is False.
Added in version 0.4.0.
- verbosebool, optional
If True, enables verbose output with informative messages during execution. Useful for debugging or understanding internal operations such as backend selection, font loading, and file saving status. If False, runs silently unless errors occur.
Default is False.
Added in version 0.4.0: The
verboseparameter was added to control logging and user feedback verbosity.
- Raises:
- TypeError
If
highlight_ntileis not specified as an int.- ValueError
If the wrong
highlight_howvalue is specified.
- Parameters:
plot_input (pandas.DataFrame)