plot_pca_component_variance#
- scikitplot.decomposition.plot_pca_component_variance(clf, title='PCA Component Explained Variances', ax=None, figsize=None, title_fontsize='large', text_fontsize='medium', target_explained_variance=0.75, x_tick_rotation=90)#
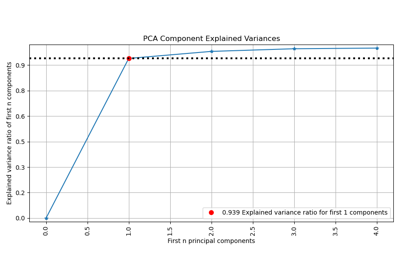
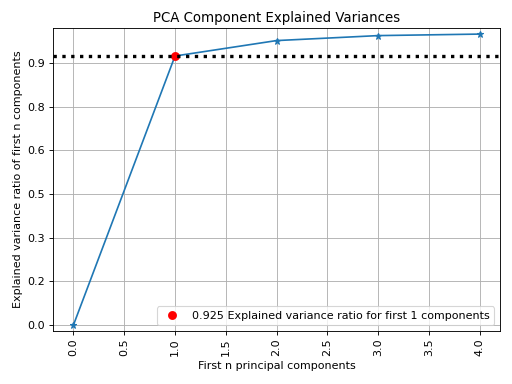
Plots PCA components’ explained variance ratios. (new in v0.2.2)
- Parameters:
clf (object) – PCA instance that has the
explained_variance_ratio_attribute.title (str, optional, default='PCA Component Explained Variances') – Title of the generated plot.
target_explained_variance (float, optional, default=0.75) – Looks for the minimum number of principal components that satisfies this value and emphasizes it on the plot.
ax (matplotlib.axes.Axes, optional, default=None) – The axes upon which to plot the curve. If None, a new set of axes is created.
figsize (tuple of int, optional, default=None) – Tuple denoting figure size of the plot (e.g., (6, 6)).
title_fontsize (str or int, optional, default='large') – Font size for the plot title. Use e.g., “small”, “medium”, “large” or integer-values.
text_fontsize (str or int, optional, default='medium') – Font size for the text in the plot. Use e.g., “small”, “medium”, “large” or integer-values.
x_tick_rotation (int, optional, default=None) –
Rotates x-axis tick labels by the specified angle. Defaults to None (automatically set based on orientation).
Added in version 0.3.9.
- Returns:
The axes on which the plot was drawn.
- Return type:
Examples
>>> from sklearn.decomposition import PCA
>>> from sklearn.datasets import load_iris as data_3_classes
>>> import scikitplot as skplt
>>> X, y = data_3_classes(return_X_y=True, as_frame=False)
>>> pca = PCA(random_state=0).fit(X)
>>> skplt.decomposition.plot_pca_component_variance(pca);
(
Source code,png)