Precision annoy.AnnoyIndex with examples#
An example showing the AnnoyIndex class.
from __future__ import print_function

import random; random.seed(0)
import time

# from annoy import AnnoyIndex
# from scikitplot.annoy import AnnoyIndex
from scikitplot.annoy import Index as AnnoyIndex

try:
    from tqdm.auto import tqdm, trange
except ImportError:
    # Fallback: dummy versions that ignore all args/kwargs
    tqdm = lambda iterable, *args, **kwargs: iterable
    trange = lambda n, *args, **kwargs: range(n)
n, f = 1_000_000, 100 # 100~2.5GB
n, f = 1_000, 100  # 100~0.25GB 256~0.6GB


idx = AnnoyIndex(
    f=f,
    metric='angular',
)
idx.set_seed(0)
for i in trange(n):
    if(i % (n//10) == 0): print(f"{i} / {n} = {1.0 * i / n}")
    # v = []
    # for z in range(f):
    #     v.append(random.gauss(0, 1))
    v = [random.gauss(0, 1) for _ in range(f)]
    idx.add_item(i, v)

idx.build(2 * f)
idx.save('test.annoy')
idx.info()
/home/circleci/repo/galleries/examples/annoy/plot_precision_script.py:37: UserWarning: seed=0 resets to Annoy's default seed
  idx.set_seed(0)

  0%|          | 0/1000 [00:00<?, ?it/s]0 / 1000 = 0.0
100 / 1000 = 0.1
200 / 1000 = 0.2
300 / 1000 = 0.3
400 / 1000 = 0.4
500 / 1000 = 0.5
600 / 1000 = 0.6
700 / 1000 = 0.7
800 / 1000 = 0.8
900 / 1000 = 0.9

100%|██████████| 1000/1000 [00:00<00:00, 10792.95it/s]

{'f': 100, 'metric': 'angular', 'n_neighbors': 5, 'on_disk_path': 'test.annoy', 'prefault': False, 'seed': None, 'verbose': None, 'schema_version': 0, 'n_items': 1000, 'n_trees': 200, 'memory_usage_byte': 5722240, 'memory_usage_mib': 5.4571533203125}
def plot(idx, y=None, **kwargs):
    import numpy as np
    import matplotlib.pyplot as plt
    import scikitplot.cexternals._annoy._plotting as utils

    single = np.zeros(idx.get_n_items(), dtype=int)
    if y is None:
        double = np.random.uniform(0, 1, idx.get_n_items()).round()

    # single vs double
    fig, ax = plt.subplots(ncols=2, figsize=(12, 5))
    alpha = kwargs.pop("alpha", 0.8)
    y2 = utils.plot_annoy_index(
        idx,
        dims = list(range(idx.f)),
        plot_kwargs={"draw_legend": False},
        ax=ax[0],
    )[0]
    utils.plot_annoy_knn_edges(
        idx,
        y2,
        k=1,
        line_kwargs={"alpha": alpha},
        ax=ax[1],
    )

# idx.unbuild()
# idx.build(10)
plot(idx)
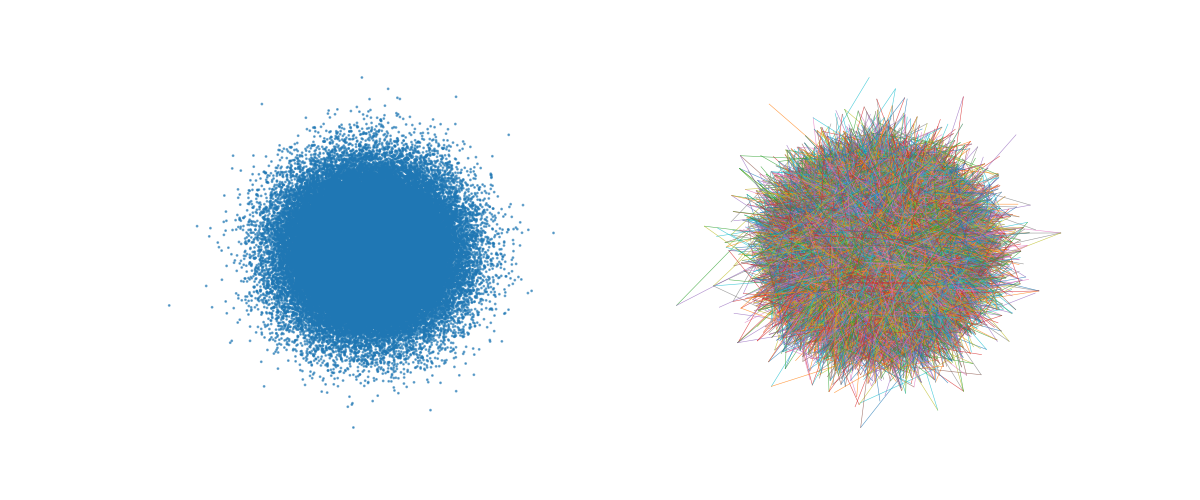
def precision(q):
  limits = [10, 100, 1_000]
  k = 10
  prec_n = 10
  prec_sum = {}
  time_sum = {}

  for i in trange(prec_n):
    j = random.randrange(0, n)
    closest = set(q.get_nns_by_item(j, k, n))
    for limit in limits:
        t0 = time.time()
        toplist = q.get_nns_by_item(j, k, limit)
        T = time.time() - t0

        found = len(closest.intersection(toplist))
        hitrate = 1.0 * found / k
        prec_sum[limit] = prec_sum.get(limit, 0.0) + hitrate
        time_sum[limit] = time_sum.get(limit, 0.0) + T

        print('limit: %-9d precision: %6.2f%% avg time: %.6fs'
              % (limit, 100.0 * prec_sum[limit] / (i + 1), time_sum[limit] / (i + 1)))
q = AnnoyIndex(f, 'angular')
q.set_seed(0)
q.load('test.annoy')
precision(q)
/home/circleci/repo/galleries/examples/annoy/plot_precision_script.py:110: UserWarning: seed=0 resets to Annoy's default seed
  q.set_seed(0)

  0%|          | 0/10 [00:00<?, ?it/s]limit: 10        precision:  20.00% avg time: 0.000050s
limit: 100       precision:  40.00% avg time: 0.000049s
limit: 1000      precision: 100.00% avg time: 0.000130s
limit: 10        precision:  35.00% avg time: 0.000044s
limit: 100       precision:  45.00% avg time: 0.000047s
limit: 1000      precision: 100.00% avg time: 0.000130s
limit: 10        precision:  36.67% avg time: 0.000041s
limit: 100       precision:  53.33% avg time: 0.000047s
limit: 1000      precision: 100.00% avg time: 0.000136s
limit: 10        precision:  37.50% avg time: 0.000040s
limit: 100       precision:  52.50% avg time: 0.000047s
limit: 1000      precision: 100.00% avg time: 0.000133s
limit: 10        precision:  38.00% avg time: 0.000046s
limit: 100       precision:  54.00% avg time: 0.000047s
limit: 1000      precision: 100.00% avg time: 0.000133s
limit: 10        precision:  40.00% avg time: 0.000045s
limit: 100       precision:  53.33% avg time: 0.000047s
limit: 1000      precision: 100.00% avg time: 0.000131s
limit: 10        precision:  38.57% avg time: 0.000044s
limit: 100       precision:  54.29% avg time: 0.000049s
limit: 1000      precision: 100.00% avg time: 0.000131s
limit: 10        precision:  38.75% avg time: 0.000044s
limit: 100       precision:  52.50% avg time: 0.000048s
limit: 1000      precision: 100.00% avg time: 0.000132s
limit: 10        precision:  38.89% avg time: 0.000043s
limit: 100       precision:  54.44% avg time: 0.000048s
limit: 1000      precision: 100.00% avg time: 0.000131s
limit: 10        precision:  39.00% avg time: 0.000043s
limit: 100       precision:  55.00% avg time: 0.000052s
limit: 1000      precision: 100.00% avg time: 0.000133s

100%|██████████| 10/10 [00:00<00:00, 1609.17it/s]
Total running time of the script: (0 minutes 2.691 seconds)
Related examples