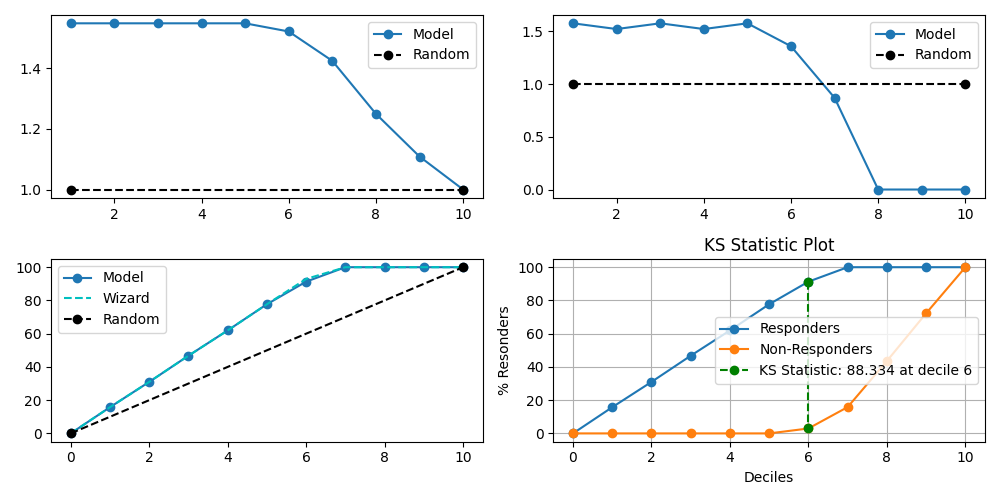
plot_report with examples#
An example showing the report function
with a scikit-learn classifier (e.g., LogisticRegression) instance.
# Authors: The scikit-plots developers
# SPDX-License-Identifier: BSD-3-Clause
from sklearn.datasets import (
    load_breast_cancer as data_2_classes,
    # load_iris as data_3_classes,
)
from sklearn.linear_model import LogisticRegression
from sklearn.model_selection import train_test_split

# importing pylab or pyplot
import matplotlib.pyplot as plt
import numpy as np; np.random.seed(0)  # reproducibility

# Import scikit-plot
import scikitplot.decile as sp

# Load the data
X, y = data_2_classes(return_X_y=True, as_frame=False)
X_train, X_val, y_train, y_val = train_test_split(X, y, test_size=0.5, random_state=0)

# Create an instance of the LogisticRegression
model = LogisticRegression(max_iter=int(1e5), random_state=0).fit(X_train, y_train)

# Perform predictions
y_val_prob = model.predict_proba(X_val)
sp.kds.decile_table(
    y_val,
    y_val_prob,
    save_fig=True,
    save_fig_filename="",
    # overwrite=True,
    add_timestamp=True,
    # verbose=True,
    display_term_tables=True,
)
Plot!
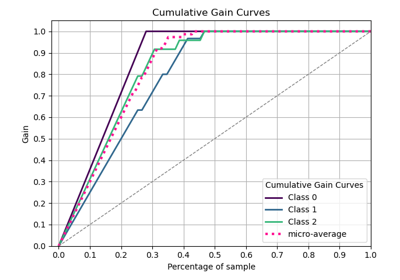
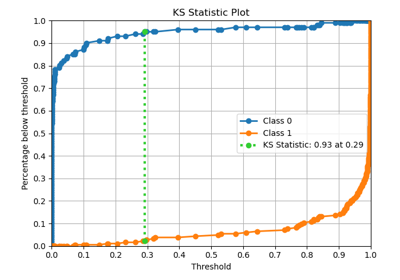
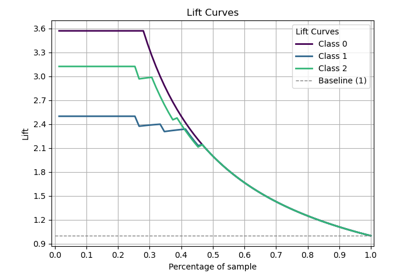
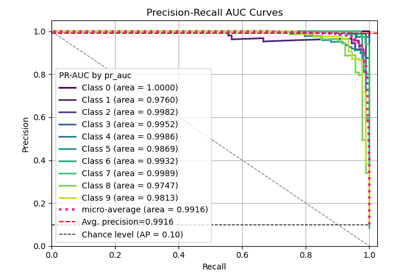
ax = sp.kds.report(
    y_val,
    y_val_prob,
    save_fig=True,
    save_fig_filename="",
    # overwrite=True,
    add_timestamp=True,
    # verbose=True,
    display_term_tables=True,
)
LABELS INFO:

 prob_min         : Minimum probability in a particular decile
 prob_max         : Minimum probability in a particular decile
 prob_avg         : Average probability in a particular decile
 cnt_events       : Count of events in a particular decile
 cnt_resp         : Count of responders in a particular decile
 cnt_non_resp     : Count of non-responders in a particular decile
 cnt_resp_rndm    : Count of responders if events assigned randomly in a particular decile
 cnt_resp_wiz     : Count of best possible responders in a particular decile
 resp_rate        : Response Rate in a particular decile [(cnt_resp/cnt_cust)*100]
 cum_events       : Cumulative sum of events decile-wise
 cum_resp         : Cumulative sum of responders decile-wise
 cum_resp_wiz     : Cumulative sum of best possible responders decile-wise
 cum_non_resp     : Cumulative sum of non-responders decile-wise
 cum_events_pct   : Cumulative sum of percentages of events decile-wise
 cum_resp_pct     : Cumulative sum of percentages of responders decile-wise
 cum_resp_pct_wiz : Cumulative sum of percentages of best possible responders decile-wise
 cum_non_resp_pct : Cumulative sum of percentages of non-responders decile-wise
 KS               : KS Statistic decile-wise
 lift             : Cumuative Lift Value decile-wise
Total running time of the script: (0 minutes 3.467 seconds)
Related examples