plot_cumlift#
- scikitplot.decile.plot_cumlift(plot_input, *, highlight_ntile=None, highlight_how='plot_text', line_kws=None, ref_line_kws=None, legend_kws=None, grid_kws=None, axes_kws=None, annotation_kws=None, footer_kws=None, save_fig=True, save_fig_filename='', **kwargs)[source]#
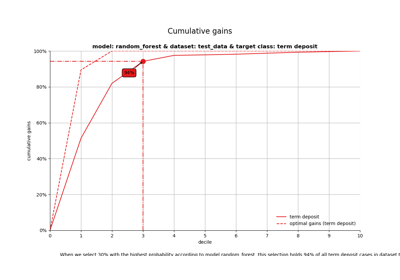
Plot cumulative lift curve.
- Parameters:
- plot_inputpandas.DataFrame
Output of
ModelPlotPy.plotting_scope.- highlight_ntileint, Sequence[int], or None, default=None
Ntile index/indices to highlight (each must be in
1..ntiles).- highlight_how{‘plot’, ‘text’, ‘plot_text’}, default=’plot_text’
Where to render highlight information.
- line_kws, ref_line_kws, legend_kws, grid_kws, axes_kws, annotation_kws, footer_kwsMapping[str, Any] or None
Per-component styling kwargs.
- **kwargsAny
Legacy alias for
line_kws.
- Returns:
- matplotlib.axes.Axes
Axes containing the plot.
- Other Parameters:
- show_figbool, default=True
Show the plot.
Added in version 0.4.0.
- save_figbool, default=False
Save the plot. Used by
save_plot_decorator.Added in version 0.4.0.
- save_fig_filenamestr, optional, default=’’
Specify the path and filetype to save the plot. If nothing specified, the plot will be saved as png inside
result_imagesunder to the current working directory. Defaults to plot image named to usedfunc.__name__. Used bysave_plot_decorator.Added in version 0.4.0.
- overwritebool, optional, default=True
If False and a file exists, auto-increments the filename to avoid overwriting.
Added in version 0.4.0.
- add_timestampbool, optional, default=False
Whether to append a timestamp to the filename. Default is False.
Added in version 0.4.0.
- verbosebool, optional
If True, enables verbose output with informative messages during execution. Useful for debugging or understanding internal operations such as backend selection, font loading, and file saving status. If False, runs silently unless errors occur.
Default is False.
Added in version 0.4.0: The
verboseparameter was added to control logging and user feedback verbosity.
- Raises:
- _PlotInputError
If plot_input lacks required columns.
- Parameters:
- Return type:
See also
Notes
Lift is a ratio (baseline = 1.0). It is highlighted as cumulative 1..N.
Examples
>>> # ax = plot_cumlift(plot_input)