ProbScale#
- class scikitplot.externals._probscale.ProbScale(*args, **kwargs)[source]#
A probability scale for matplotlib Axes.
Transforms an axis so that normally distributed data plot as a straight line. Tick locations correspond to probability (or percentage) values; the underlying quantile mapping is supplied by dist.
- Parameters:
- *argspositional arguments (absorbed, not used)
Prior to matplotlib 3.11
scale_factoryunconditionally passed theaxisartist as the first positional argument to every scale constructor. From 3.11 onwards, the positional argument is only passed when"axis"appears ininspect.signature(cls). Using*argsabsorbs the positional argument on older matplotlib versions without placing the string"axis"in the inspected signature, which would trigger aPendingDeprecationWarning.- distscipy.stats-compatible distribution, optional
Object that provides
ppf(q)(quantile function) andcdf(x)(CDF) class or instance methods. Defaults to_minimal_normso that scipy is not a hard dependency.- as_pctbool, optional
When
True(default) tick labels are shown as percentages (0 – 100). WhenFalsethey are shown as proportions (0 – 1).- nonpos{‘mask’, ‘clip’}, optional
Strategy for data outside the valid probability range; forwarded to
ProbTransform. Default is'mask'.
- Attributes:
- namestr
The string name used to register this scale with matplotlib:
'prob'.- distdistribution object
The distribution used for the probability mapping.
- as_pctbool
Whether tick labels are rendered as percentages.
- nonposstr
Out-of-bounds handling strategy (
'mask'or'clip').
- Parameters:
args (Any)
kwargs (Any)
See also
matplotlib.scale.ScaleBaseAbstract base class for all scales.
transforms.ProbTransformThe underlying matplotlib Transform.
_minimal_normDefault distribution (scipy-free).
Notes
User note — Register and use with:
import scikitplot.externals._probscale  # registers 'prob' scale
fig, ax = pyplot.subplots()
ax.set_yscale('prob')
ax.set_ylim(0.5, 99.5)
Developer note —
*argsis intentional; see the module-level docstring for the complete compatibility matrix and rationale. Theaxispositional argument is never read inside this constructor; all configuration is driven by keyword arguments.References
[1]matplotlib scales documentation: https://matplotlib.org/stable/gallery/scales/scales.html
[2]mpl-probscale upstream: matplotlib/mpl-probscale
Examples
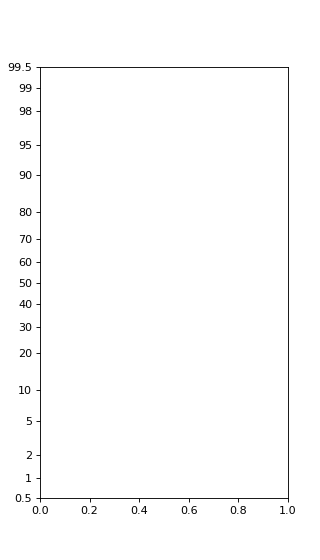
Basic probability scale (percentage labels):
>>> import scikitplot.externals._probscale  # registers 'prob' scale
>>> from matplotlib import pyplot
>>> fig, ax = pyplot.subplots(figsize=(4, 7))
>>> ax.set_ylim(bottom=0.5, top=99.5)
>>> ax.set_yscale('prob')
(
Source code,png)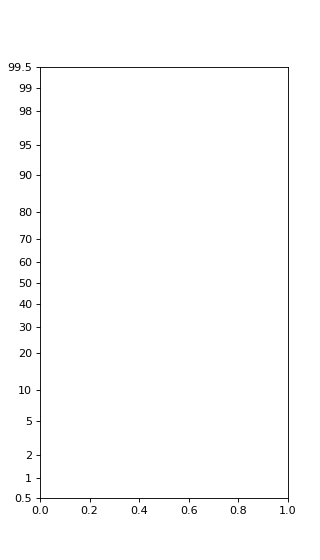
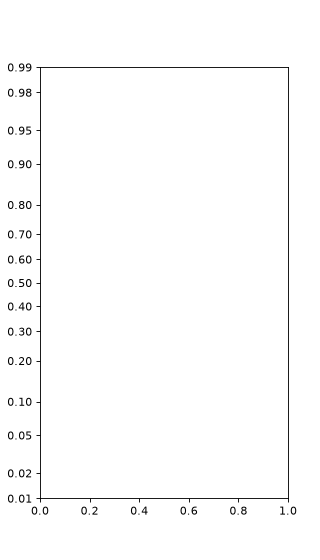
Proportion labels and a custom distribution:
>>> from scipy import stats
>>> fig, ax = pyplot.subplots(figsize=(4, 7))
>>> ax.set_ylim(bottom=0.01, top=0.99)
>>> ax.set_yscale('prob', as_pct=False, dist=stats.norm)
(
Source code,png)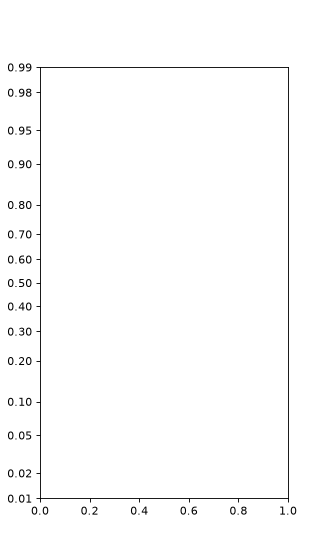
- get_transform()[source]#
Return the probability transform for this scale.
- Returns:
- transform.transforms.ProbTransform
The
Transforminstance that maps probability / percentage values to quantile space (and vice versa via itsinvertedtwinQuantileTransform).
- Return type:
ProbTransform
- limit_range_for_scale(vmin, vmax, minpos)[source]#
Clamp axis limits to positive probability values.
Any limit at or below zero is replaced by minpos, the smallest strictly-positive value on the axis, so that the probability transform (which is undefined at 0 and 1) always receives a valid input.
- Parameters:
- vminfloat
Current lower axis limit.
- vmaxfloat
Current upper axis limit.
- minposfloat
Smallest strictly-positive data value visible on the axis; supplied by matplotlib.
- Returns:
- vmin_newfloat
Clamped lower limit.
- vmax_newfloat
Clamped upper limit.
- Parameters:
- Return type:
Notes
The original implementation used the Python-2-era idiom
vmin <= 0.0 and minpos or vmin. This is equivalent tominpos if vmin <= 0.0 else vminonly when minpos is truthy. If minpos were0orNonethe idiom would silently return vmin (the wrong branch). The explicit ternary form used here is always correct regardless of the truthiness of minpos.
- set_default_locators_and_formatters(axis)[source]#
Configure probability-scale locators and formatters.
Sets a
FixedLocatorat standard probability tick positions, aFuncFormatterthat renders probabilities as percentages or proportions, andNullLocator/NullFormatterfor minor ticks.- Parameters:
- axismatplotlib.axis.Axis
The axis whose locators and formatters will be configured.
- Parameters:
axis (Any)
- Return type:
None
- val_in_range(val)[source]#
Return whether the value(s) are within the valid range for this scale.
Accepts a scalar or array-like
val. For a scalar, returns a Pythonbool. For an array, returns a bool ndarray of the same shape. This is a generic implementation, and subclasses may implement more efficient solutions for their domain.