plot_learning_curve#
- scikitplot.api.estimators.plot_learning_curve(estimator, X, y, *, train_sizes=None, cv=None, scoring=None, n_jobs=None, verbose=0, shuffle=False, random_state=None, fit_params=None, title='Learning Curves', title_fontsize='large', text_fontsize='medium', **kwargs)[source]#
Generates a plot of the train and test learning curves for a classifier.
The learning curves plot the performance of a classifier as a function of the number of training samples. This helps in understanding how well the classifier performs with different amounts of training data.
- Parameters:
- estimatorobject type that implements the “fit” method
An object of that type which is cloned for each validation. It must also implement “predict” unless
scoringis a callable that doesn’t rely on “predict” to compute a score.- Xarray-like, shape (n_samples, n_features)
Training data, where
n_samplesis the number of samples andn_featuresis the number of features.- yarray-like, shape (n_samples,) or (n_samples, n_features), optional
Target relative to
Xfor classification or regression. None for unsupervised learning.- train_sizesiterable, optional
Determines the training sizes used to plot the learning curve. If None,
np.linspace(.1, 1.0, 5)is used.- cvint, cross-validation generator, iterable or None, default=5
Determines the cross-validation splitting strategy. Possible inputs for cv are: - None, to use the default 5-fold cross validation, - integer, to specify the number of folds. - CV splitter, - An iterable that generates (train, test) splits as arrays of indices.
For integer/None inputs, if classifier is True and
yis either binary or multiclass,StratifiedKFoldis used. In all other cases,KFoldis used.Refer User Guide for the various cross-validation strategies that can be used here.
- scoringstr, callable, or None, optional, default=None
A string (see scikit-learn model evaluation documentation) or a scorer callable object/function with signature
scorer(estimator, X, y).- n_jobsint, optional, default=None
Number of jobs to run in parallel. Training the estimator and computing the score are parallelized over the different training and test sets.
Nonemeans 1 unless in ajoblib.parallel_backendcontext.-1means using all processors. See Glossary for more details.- verboseint, default=0
Controls the verbosity: the higher, the more messages.
- shufflebool, optional, default=True
Whether to shuffle the training data before splitting using cross-validation.
- random_stateint or RandomState, optional
Pseudo-random number generator state used for random sampling.
- fit_paramsdict, default=None
Parameters to pass to the fit method of the estimator.
Added in version 0.3.9.
- titlestr, optional, default=”Learning Curves”
Title of the generated plot.
- title_fontsizestr or int, optional, default=’large’
Font size for the plot title. Use e.g., “small”, “medium”, “large” or integer values.
- text_fontsizestr or int, optional, default=’medium’
Font size for the text in the plot. Use e.g., “small”, “medium”, “large” or integer values.
- **kwargs: dict
Generic keyword arguments.
- Returns:
- axmatplotlib.axes.Axes
The axes on which the plot was drawn.
References * “scikit-learn learning_curve”.#
- Other Parameters:
- axmatplotlib.axes.Axes, optional, default=None
The axis to plot the figure on. If None is passed in the current axes will be used (or generated if required).
Added in version 0.4.0.
- figmatplotlib.pyplot.figure, optional, default: None
The figure to plot the Visualizer on. If None is passed in the current plot will be used (or generated if required).
Added in version 0.4.0.
- figsizetuple, optional, default=None
Width, height in inches. Tuple denoting figure size of the plot e.g. (12, 5)
Added in version 0.4.0.
- nrowsint, optional, default=1
Number of rows in the subplot grid.
Added in version 0.4.0.
- ncolsint, optional, default=1
Number of columns in the subplot grid.
Added in version 0.4.0.
- plot_stylestr, optional, default=None
Check available styles with “plt.style.available”. Examples include: [‘ggplot’, ‘seaborn’, ‘bmh’, ‘classic’, ‘dark_background’, ‘fivethirtyeight’, ‘grayscale’, ‘seaborn-bright’, ‘seaborn-colorblind’, ‘seaborn-dark’, ‘seaborn-dark-palette’, ‘tableau-colorblind10’, ‘fast’].
Added in version 0.4.0.
- show_figbool, default=True
Show the plot.
Added in version 0.4.0.
- save_figbool, default=False
Save the plot. Used by
save_plot_decorator.Added in version 0.4.0.
- save_fig_filenamestr, optional, default=’’
Specify the path and filetype to save the plot. If nothing specified, the plot will be saved as png inside
result_imagesunder to the current working directory. Defaults to plot image named to usedfunc.__name__. Used bysave_plot_decorator.Added in version 0.4.0.
- overwritebool, optional, default=True
If False and a file exists, auto-increments the filename to avoid overwriting.
Added in version 0.4.0.
- add_timestampbool, optional, default=False
Whether to append a timestamp to the filename. Default is False.
Added in version 0.4.0.
- verbosebool, optional
If True, enables verbose output with informative messages during execution. Useful for debugging or understanding internal operations such as backend selection, font loading, and file saving status. If False, runs silently unless errors occur.
Default is False.
Added in version 0.4.0: The
verboseparameter was added to control logging and user feedback verbosity.
Examples
>>> from sklearn.datasets import load_digits as data_10_classes
>>> from sklearn.model_selection import train_test_split
>>> from sklearn.naive_bayes import GaussianNB
>>> import scikitplot as skplt
>>> X, y = data_10_classes(return_X_y=True, as_frame=False)
>>> X_train, X_val, y_train, y_val = train_test_split(
...     X, y, test_size=0.5, random_state=0
... )
>>> model = GaussianNB()
>>> model.fit(X_train, y_train)
>>> y_val_pred = model.predict(X_val)
>>> skplt.estimators.plot_learning_curve(
>>>     model, X_val, y_val_pred,
>>> );
(
Source code,png)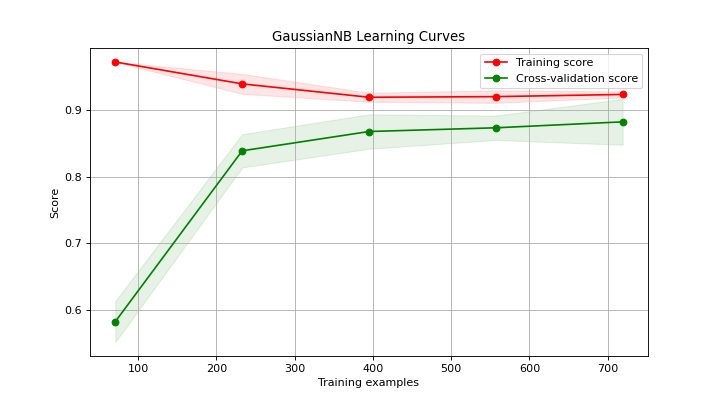