Profile, route, trace and monitor wide tables#
A walk through the three questions scikitplot.feature_selection
answers for a table with many columns:
What is each feature? –
profile_featuresfits aFeatureSchemaon the training split.What happened to each feature in the pipeline? –
trace_pipelinereads the fitted pipeline, andFeatureLineage.attributesums one-hot importances back to raw columns.Has it drifted? –
ReferenceProfilefreezes the training distribution and compares later data with it.
# Authors: The scikit-plots developers
# SPDX-License-Identifier: BSD-3-Clause
A synthetic customer table#
import matplotlib.pyplot as plt
import numpy as np
import pandas as pd
from sklearn.compose import ColumnTransformer
from sklearn.ensemble import RandomForestClassifier
from sklearn.impute import SimpleImputer
from sklearn.model_selection import train_test_split
from sklearn.pipeline import Pipeline
from sklearn.preprocessing import OneHotEncoder, PowerTransformer, StandardScaler

from scikitplot.feature_selection import (
    FeatureColumnSelector,
    FeatureFilter,
    ReferenceProfile,
    profile_features,
    recommend_treatments,
    trace_pipeline,
)

rng = np.random.default_rng(0)
n = 2000
X = pd.DataFrame(
    {
        "customer_id": [f"c{i:05d}" for i in range(n)],
        "income": rng.lognormal(10, 1, n),
        "age": rng.normal(45, 12, n).round(1),
        "kids": rng.integers(0, 4, n),
        "city": rng.choice(["ankara", "izmir", "bursa", "van"], n),
        "segment": rng.choice(["a", "b"], n),
        "constant": 1.0,
    }
)
X.loc[::11, "age"] = np.nan
y = (X["income"] > X["income"].median()).astype(int) ^ (rng.random(n) < 0.2)
X_train, X_test, y_train, y_test = train_test_split(X, y, random_state=0)
1. What is each feature?#
Fit on the training split only; thresholds come from the policy.
policy = {"roles": {"identifier": ["customer_id"]}}
schema = profile_features(X_train, policy)
schema.summary()[["role", "kind", "n_unique", "skewness", "skewed", "constant"]]
print(schema["income"].explain())
income: numeric_continuous (inferred), role=feature, dtype=float64
  rows=1500 missing=0 (0.0%) unique=1500
  min=900.234 median=20731.3 max=380581 skewness=3.51
  is: has_outliers, non_negative, skewed
  binning: 64 uniform bins (auto)
Groups by kind, and the advisory treatment per feature:
print(schema.groups(by="kind"))
recommend_treatments(schema)[["kind", "steps"]]
{'binary': ['segment'], 'categorical_nominal': ['city'], 'numeric_continuous': ['income', 'age'], 'numeric_discrete': ['kids', 'constant']}
Route columns into a pipeline by their assessments#
pre = ColumnTransformer(
    [
        (
            "skewed",
            PowerTransformer(),
            FeatureColumnSelector(kind="numeric_continuous", is_=("skewed",)),
        ),
        (
            "numeric",
            Pipeline([("imp", SimpleImputer()), ("sc", StandardScaler())]),
            FeatureColumnSelector(
                kind=("numeric_continuous", "numeric_discrete"),
                is_not=("skewed", "constant"),
            ),
        ),
        (
            "categorical",
            OneHotEncoder(handle_unknown="ignore", sparse_output=False),
            FeatureColumnSelector(
                kind=("categorical_nominal", "binary"), is_not=("identifier_like",)
            ),
        ),
    ]
)
model = Pipeline(
    [
        ("filter", FeatureFilter(policy=policy)),
        ("pre", pre),
        ("rf", RandomForestClassifier(n_estimators=100, random_state=0)),
    ]
).fit(X_train, y_train)
print(f"test accuracy: {model.score(X_test, y_test):.3f}")
test accuracy: 0.788
2. What happened to each feature?#
lineage = trace_pipeline(model, X=X_train.head(100))
lineage.stage_summary()[["path", "estimator", "relation", "n_in", "n_out"]]
lineage.treatments()
print(lineage.dropped())
{'customer_id': 'filter', 'constant': 'filter'}
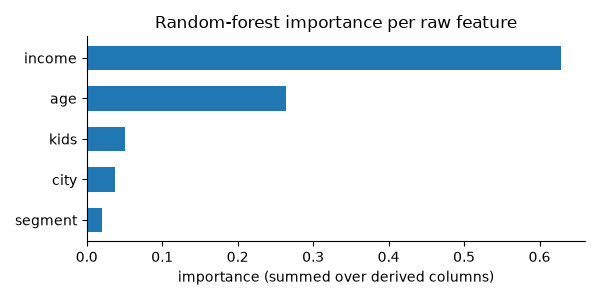
Importances of one-hot columns summed back to their raw column:
attribution = lineage.attribute(model[-1].feature_importances_)
by_feature = attribution.by_input.sort_values()

fig, ax = plt.subplots(figsize=(6, 3))
ax.barh(by_feature.index, by_feature.to_numpy(), height=0.6)
ax.set_xlabel("importance (summed over derived columns)")
ax.set_title("Random-forest importance per raw feature")
ax.spines[["top", "right"]].set_visible(False)
fig.tight_layout()
3. Has it drifted?#
reference = ReferenceProfile.fit(X_train, schema)
later = X_test.assign(income=X_test["income"] * 1.8)
reference.drift(later)[["feature", "kind", "psi", "missing_delta", "status"]]
Total running time of the script: (0 minutes 0.833 seconds)
Related examples
Enhanced KISS Random Generator - Complete Usage Examples