stack#
- scikitplot.api.stack(*figs, orient='vertical', padding=None, **kwargs)[source]#
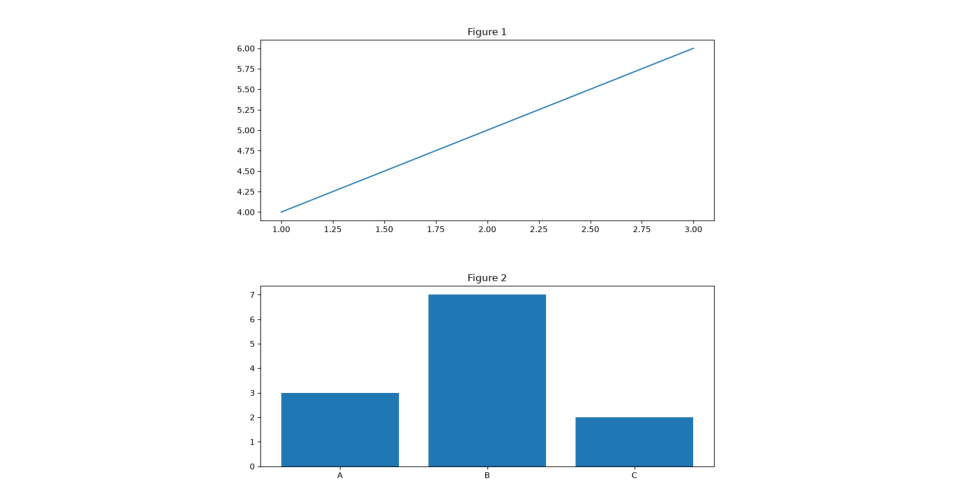
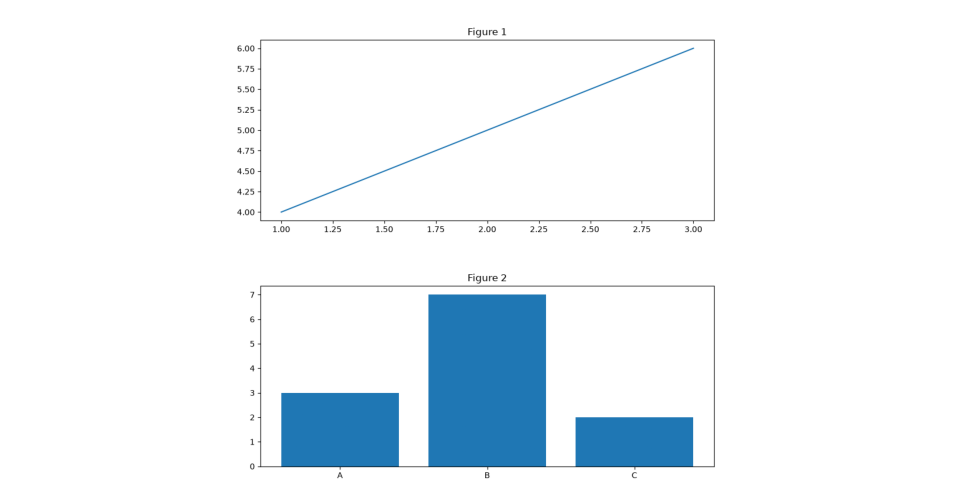
Stack multiple matplotlib figures into a single combined figure.
Save it (if specified).
- Parameters:
- figstuple of matplotlib.figure.Figure
Figures to be combined.
- orient{‘vertical’, ‘horizontal’, ‘v’, ‘h’, ‘x’, ‘y’}, default=’vertical’
Direction to stack the figures.
- paddingfloat, optional
Space between stacked figures, in inches.
- **kwargsdict
Additional keyword arguments passed to plt.subplots() (e.g., figsize, dpi).
- Returns:
- matplotlib.figure.Figure
A new combined figure containing all input figures.
- Other Parameters:
- %(_save_plot_decorator_kwargs_doc)s
- Parameters:
Examples
>>> import matplotlib.pyplot as plt
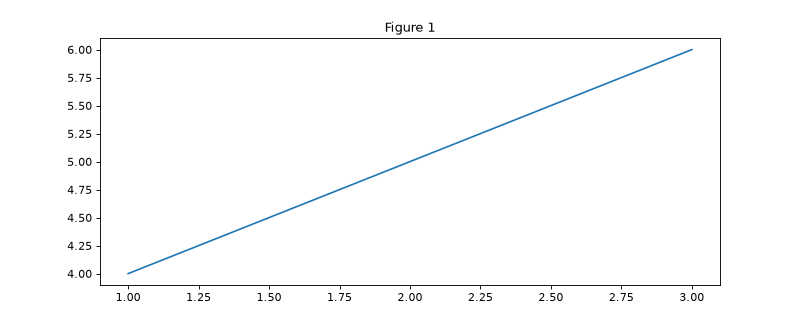
>>> fig1, ax1 = plt.subplots()
>>> ax1.plot([1, 2, 3], [4, 5, 6])
>>> ax1.set_title("Figure 1")
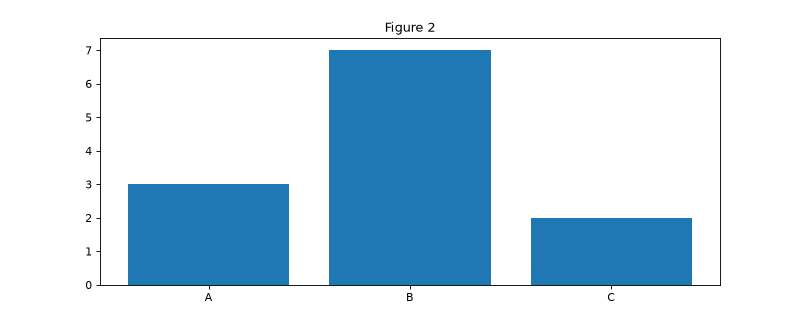
>>> fig2, ax2 = plt.subplots()
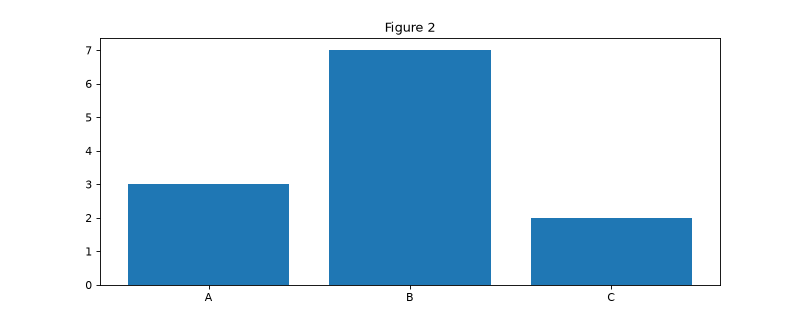
>>> ax2.bar(["A", "B", "C"], [3, 7, 2])
>>> ax2.set_title("Figure 2")
>>> import scikitplot as sp
>>> fig = sp.stack(fig1, fig2)