ProbScale#
- class scikitplot.probscale.ProbScale(axis, **kwargs)[source]#
A probability scale for matplotlib Axes.
- Parameters:
- axisa matplotlib axis artist
The axis whose scale will be set.
- distscipy.stats probability distribution, optional
The distribution whose ppf/cdf methods should be used to compute the tick positions. By default, a minimal implementation of the
scipy.stats.normclass is used so that scipy is not a requirement.
Examples
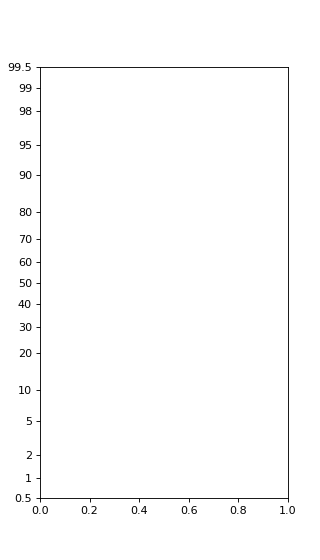
The most basic use:
>>> import scikitplot.probscale  # nothing else needed
>>> from matplotlib import pyplot
>>> fig, ax = pyplot.subplots(figsize=(4, 7))
>>> ax.set_ylim(bottom=0.5, top=99.5)
>>> ax.set_yscale('prob')
(
Source code,png)
- name = 'prob'#
