tweedie#
- scikitplot._tweedie.tweedie = <scikitplot._tweedie._tweedie_dist.tweedie_gen object>[source]#
An instance of
tweedie_gen, providing Tweedie distribution functionality.This instance provides:
probability density function (pdf)
cumulative distribution function (cdf)
random sampling
for the Tweedie distribution.
The Tweedie distribution is part of the exponential dispersion family, characterized by a
pparameter that determines its behavior:p = 0: Gaussian distributionp = 1: Poisson distributionp = 2: Gamma distributionp = 3: Inverse Gaussian distribution1 < p < 2: Compound Poisson-Gamma distribution
- Parameters:
- pfloat
Tweedie power parameter.
- mufloat
Mean or location parameter.
- phifloat
Dispersion parameter, controlling the variance of the distribution.
See also
tweedie_genA Tweedie continuous random variable.
Examples
Compute the pdf and cdf at a given point:
>>> import numpy as np
>>> from scikitplot.stats import tweedie
>>> x = 2.0
>>> pdf_val = tweedie.pdf(x, p=1.5, mu=1, phi=1)
>>> cdf_val = tweedie.cdf(x, p=1.5, mu=1, phi=1)
>>> pdf_val, cdf_val
(np.float64(0.15640119832636348), np.float64(0.8519363569424107))
Generate random variates:
>>> import numpy as np
>>> from scikitplot.stats import tweedie
>>> rvs = tweedie.rvs(p=1.5, mu=1, phi=1, size=16)
>>> rvs
array([2.29449752, 1.17941816, 1.54570298, 0.56769516, 0.        ,
       0.09808681, 0.86152258, 1.26600505, 2.71061588, 1.47716707,
       0.68610165, 0.04669872, 1.56494104, 0.77527197, 0.40942503,
       0.93184586])
Plot the pdf over a range:
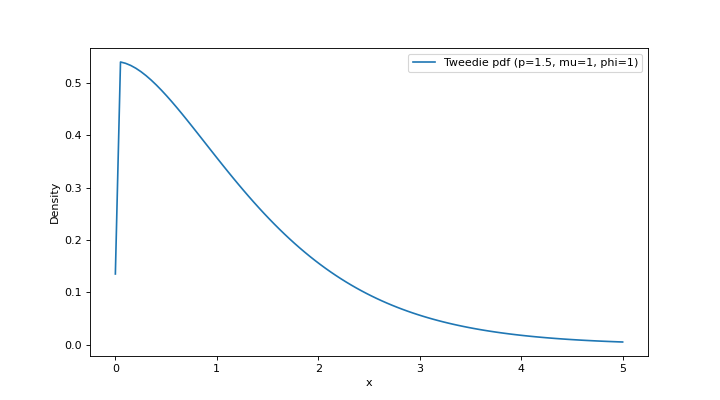
>>> import numpy as np
>>> from scikitplot.stats import tweedie
>>> import matplotlib.pyplot as plt
>>> x = np.linspace(0, 5, 100)
>>> y = tweedie.pdf(x, p=1.5, mu=1, phi=1)
>>> plt.plot(x, y, label='Tweedie pdf (p=1.5, mu=1, phi=1)')
>>> plt.xlabel("x")
>>> plt.ylabel("Density")
>>> plt.legend()
>>> plt.show()
(
Source code,png)