probplot#
- scikitplot.probscale.probplot(data, ax=None, plottype='prob', dist=None, probax='x', problabel=None, datascale='linear', datalabel=None, bestfit=False, return_best_fit_results=False, estimate_ci=False, ci_kws=None, pp_kws=None, scatter_kws=None, line_kws=None, **fgkwargs)[source]#
Probability, percentile, and quantile plots.
- Parameters:
- dataarray-like
1-dimensional data to be plotted
- axmatplotlib axes, optional
The Axes on which to plot. If one is not provided, a new Axes will be created.
- plottypestring (default = ‘prob’)
Type of plot to be created. Options are:
‘prob’: probability plot
‘pp’: percentile plot
‘qq’: quantile plot
- distscipy distribution, optional
A distribution to compute the scale’s tick positions. If not specified, a standard normal distribution will be used.
- probaxstring, optional (default = ‘x’)
The axis (‘x’ or ‘y’) that will serve as the probability (or quantile) axis.
- problabel, datalabelstring, optional
Axis labels for the probability/quantile and data axes respectively.
- datascalestring, optional (default = ‘log’)
Scale for the other axis that is not the probability (or quantile) axis.
- bestfitbool, optional (default is False)
Specifies whether a best-fit line should be added to the plot.
- return_best_fit_resultsbool (default is False)
If True a dictionary of results of is returned along with the figure.
- estimate_cibool, optional (False)
Estimate and draw a confidence band around the best-fit line using a percentile bootstrap.
- ci_kwsdict, optional
Dictionary of keyword arguments passed directly to
viz.fit_linewhen computing the best-fit line.- pp_kwsdict, optional
Dictionary of keyword arguments passed directly to
viz.plot_poswhen computing the plotting positions.- scatter_kws, line_kwsdict, optional
Dictionary of keyword arguments passed directly to
ax.plotwhen drawing the scatter points and best-fit line, respectively.
- Returns:
- figmatplotlib.Figure
The figure on which the plot was drawn.
- resultdict of linear fit results, optional
Keys are:
q : array of quantiles
x, y : arrays of data passed to function
xhat, yhat : arrays of modeled data plotted in best-fit line
res : array of coefficients of the best-fit line.
- Other Parameters:
- colorstring, optional
A directly-specified matplotlib color argument for both the data series and the best-fit line if drawn. This argument is made available for compatibility for the seaborn package and is not recommended for general use. Instead colors should be specified within
scatter_kwsandline_kws.Note
Users should not specify this parameter. It is intended to only be used by seaborn when operating within a
FacetGrid.- labelstring, optional
A directly-specified legend label for the data series. This argument is made available for compatibility for the seaborn package and is not recommended for general use. Instead the data series label should be specified within
scatter_kws.Note
Users should not specify this parameter. It is intended to only be used by seaborn when operating within a
FacetGrid.
See also
viz.plot_posviz.fit_linenumpy.polyfitscipy.stats.probplotscipy.stats.mstats.plotting_positions
Examples
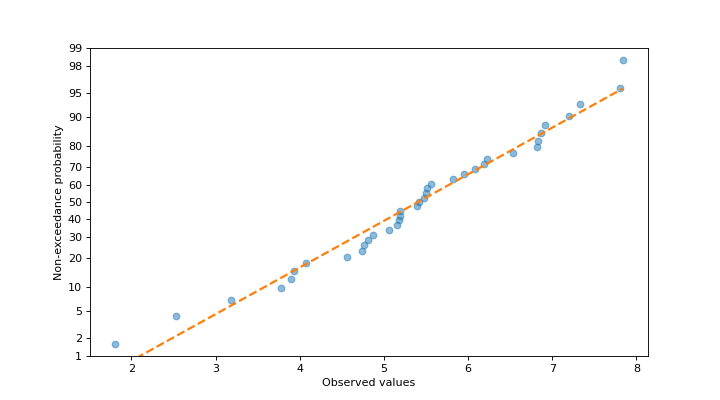
Probability plot with the probabilities on the y-axis
>>> import numpy
...
... numpy.random.seed(0)
>>> from matplotlib import pyplot
>>> from scipy import stats
>>> import scikitplot.probscale as probscale
>>> data = numpy.random.normal(loc=5, scale=1.25, size=37)
>>> fig = probscale.probplot(
...     data,
...     plottype='prob',
...     probax='y',
...     problabel='Non-exceedance probability',
...     datalabel='Observed values',
...     bestfit=True,
...     line_kws=dict(linestyle='--', linewidth=2),
...     scatter_kws=dict(marker='o', alpha=0.5),
... )
(
Source code,png)
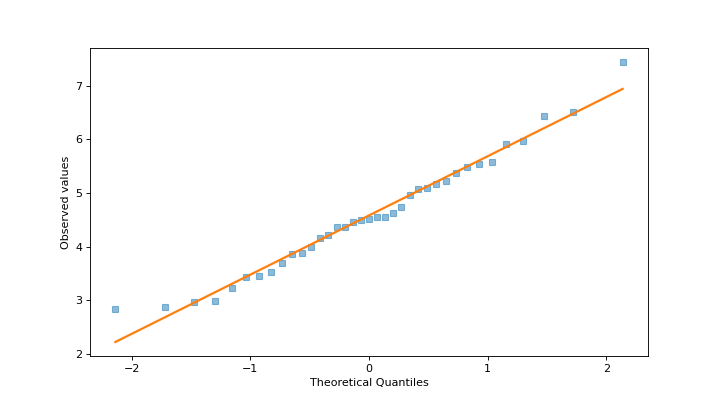
Quantile plot with the quantiles on the x-axis
>>> import scikitplot.probscale as probscale
>>> data = numpy.random.normal(loc=5, scale=1.25, size=37)
>>> fig = probscale.probplot(
...     data,
...     plottype='qq',
...     probax='x',
...     problabel='Theoretical Quantiles',
...     datalabel='Observed values',
...     bestfit=True,
...     line_kws=dict(linestyle='-', linewidth=2),
...     scatter_kws=dict(marker='s', alpha=0.5),
... )
(
Source code,png)
