plot_waveform#
- scikitplot.doremi.plot_waveform(data, sample_rate=None, normalize=False, title='Audio Waveform (Normalized 440Hz Tone)', figsize=(10, 4))[source]#
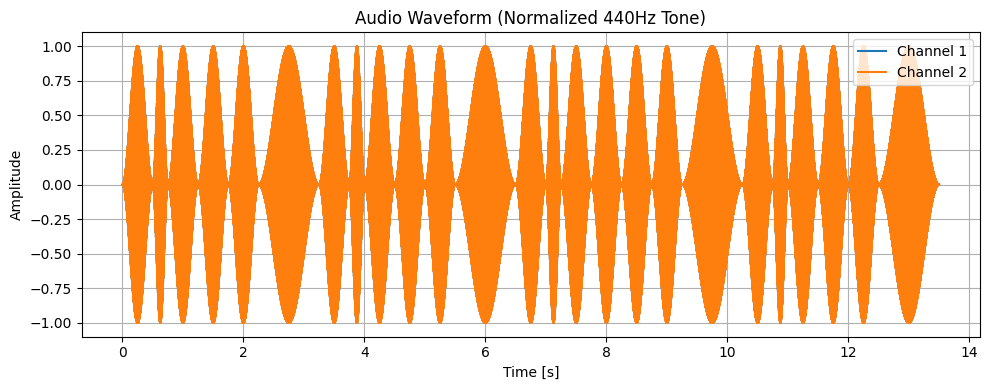
Plot the waveform of mono or multi-channel audio data.
- Parameters:
- datanp.ndarray
1D or 2D audio data. 1D for mono or 2D for multi-channel. If 2D, shape must be (samples, channels) or (channels, samples).
- sample_rateint, default=44100
Sampling rate in Hz.
- titlestr, default=”Audio Waveform”
Title of the plot.
- figsizetuple, default=(10, 4)
Matplotlib figure size.
- normalizebool, default=False
Normalize audio to [-1, 1] range before plotting.
- Raises:
- ValueError
If data is not 1D or 2D array.
- Parameters:
Notes
Mono: plotted directly.
Stereo or more: plots each channel in the same figure.
Examples
>>> t = np.linspace(0, 1, 44100)
>>> data = 0.5 * np.sin(2 * np.pi * 440 * t)
>>> plot_waveform(data, sample_rate=44100, title="440Hz Sine Wave")
>>> from scikitplot import doremi
2025-07-24 06:05:37.376076: I scikitplot 140323775576960 python.py:96:<module>] TOML write support requires `toml` package. Install via `pip install toml`.
Sample Sheet:
>>> doremi.SHEET
'\n# Format: NoteOctave-Duration\n# NoteOctave: Musical note + octave number (e.g., G4 means G in the 4th octave)\n# Duration: Length of the note (relative)\n# 1 = quarter note\n# 0.5 = eighth note\n# 2 = half note\n#\n# Happy Birthday Melody — Western notation with lyrics:\n\nG4-0.5 - G4-0.25 - A4-0.5 - G4-0.5 - C5-0.5 - B4-1\n# "Happy" "birth-" "day" "to" "you"\n\nG4-0.5 - G4-0.25 - A4-0.5 - G4-0.5 - D5-0.5 - C5-1\n# "Happy" "birth-" "day" "to" "you"\n\nG4-0.5 - G4-0.25 - G5-0.5 - E5-0.5 - C5-0.5 - B4-0.5 - A4-1\n# "Happy" "birth-" "day" "dear" "[Name]"\n\nF5-0.5 - F5-0.25 - E5-0.5 - C5-0.5 - D5-0.5 - C5-1\n# "Happy" "birth-" "day" "to" "you"\n'
Compose as Waveform:
>>> music = doremi.compose_as_waveform(doremi.SHEET, envelope="hann")
Play waveform:
>>> doremi.play_waveform(music)
{'status': 'success',
 'backend': 'jupyter',
 'blocking': True,
 'error': None,
 'source': 'music'}
Plot waveform:
>>> doremi.plot_waveform(music)
Save waveform:
>>> # doremi.save_waveform(music)